
This article covers Benefits and how they are used. In Value, a Benefit is a representation of a business benefit. For example, a benefit of using Mediafly for digital content distribution is to "Reduce print costs".
Benefits can be categorized into one of many value categories, such as Cost Avoidance, Risk Avoidance, Productivity Improvements, or Growth. In fact, as you will see later, benefits will be specifically mapped into a specific Value Category, which will help in organization when you have lots of benefits available to you.
If you are an author, benefits can be published to the Library for your organization. These can then be used across ALL Templates in your library.
Creating and Managing Benefits
After navigating to the Items link on the editor main screen, select the Benefits tab on the left. You will now see all the Benefits that have previously been added, organized by their Value Category.
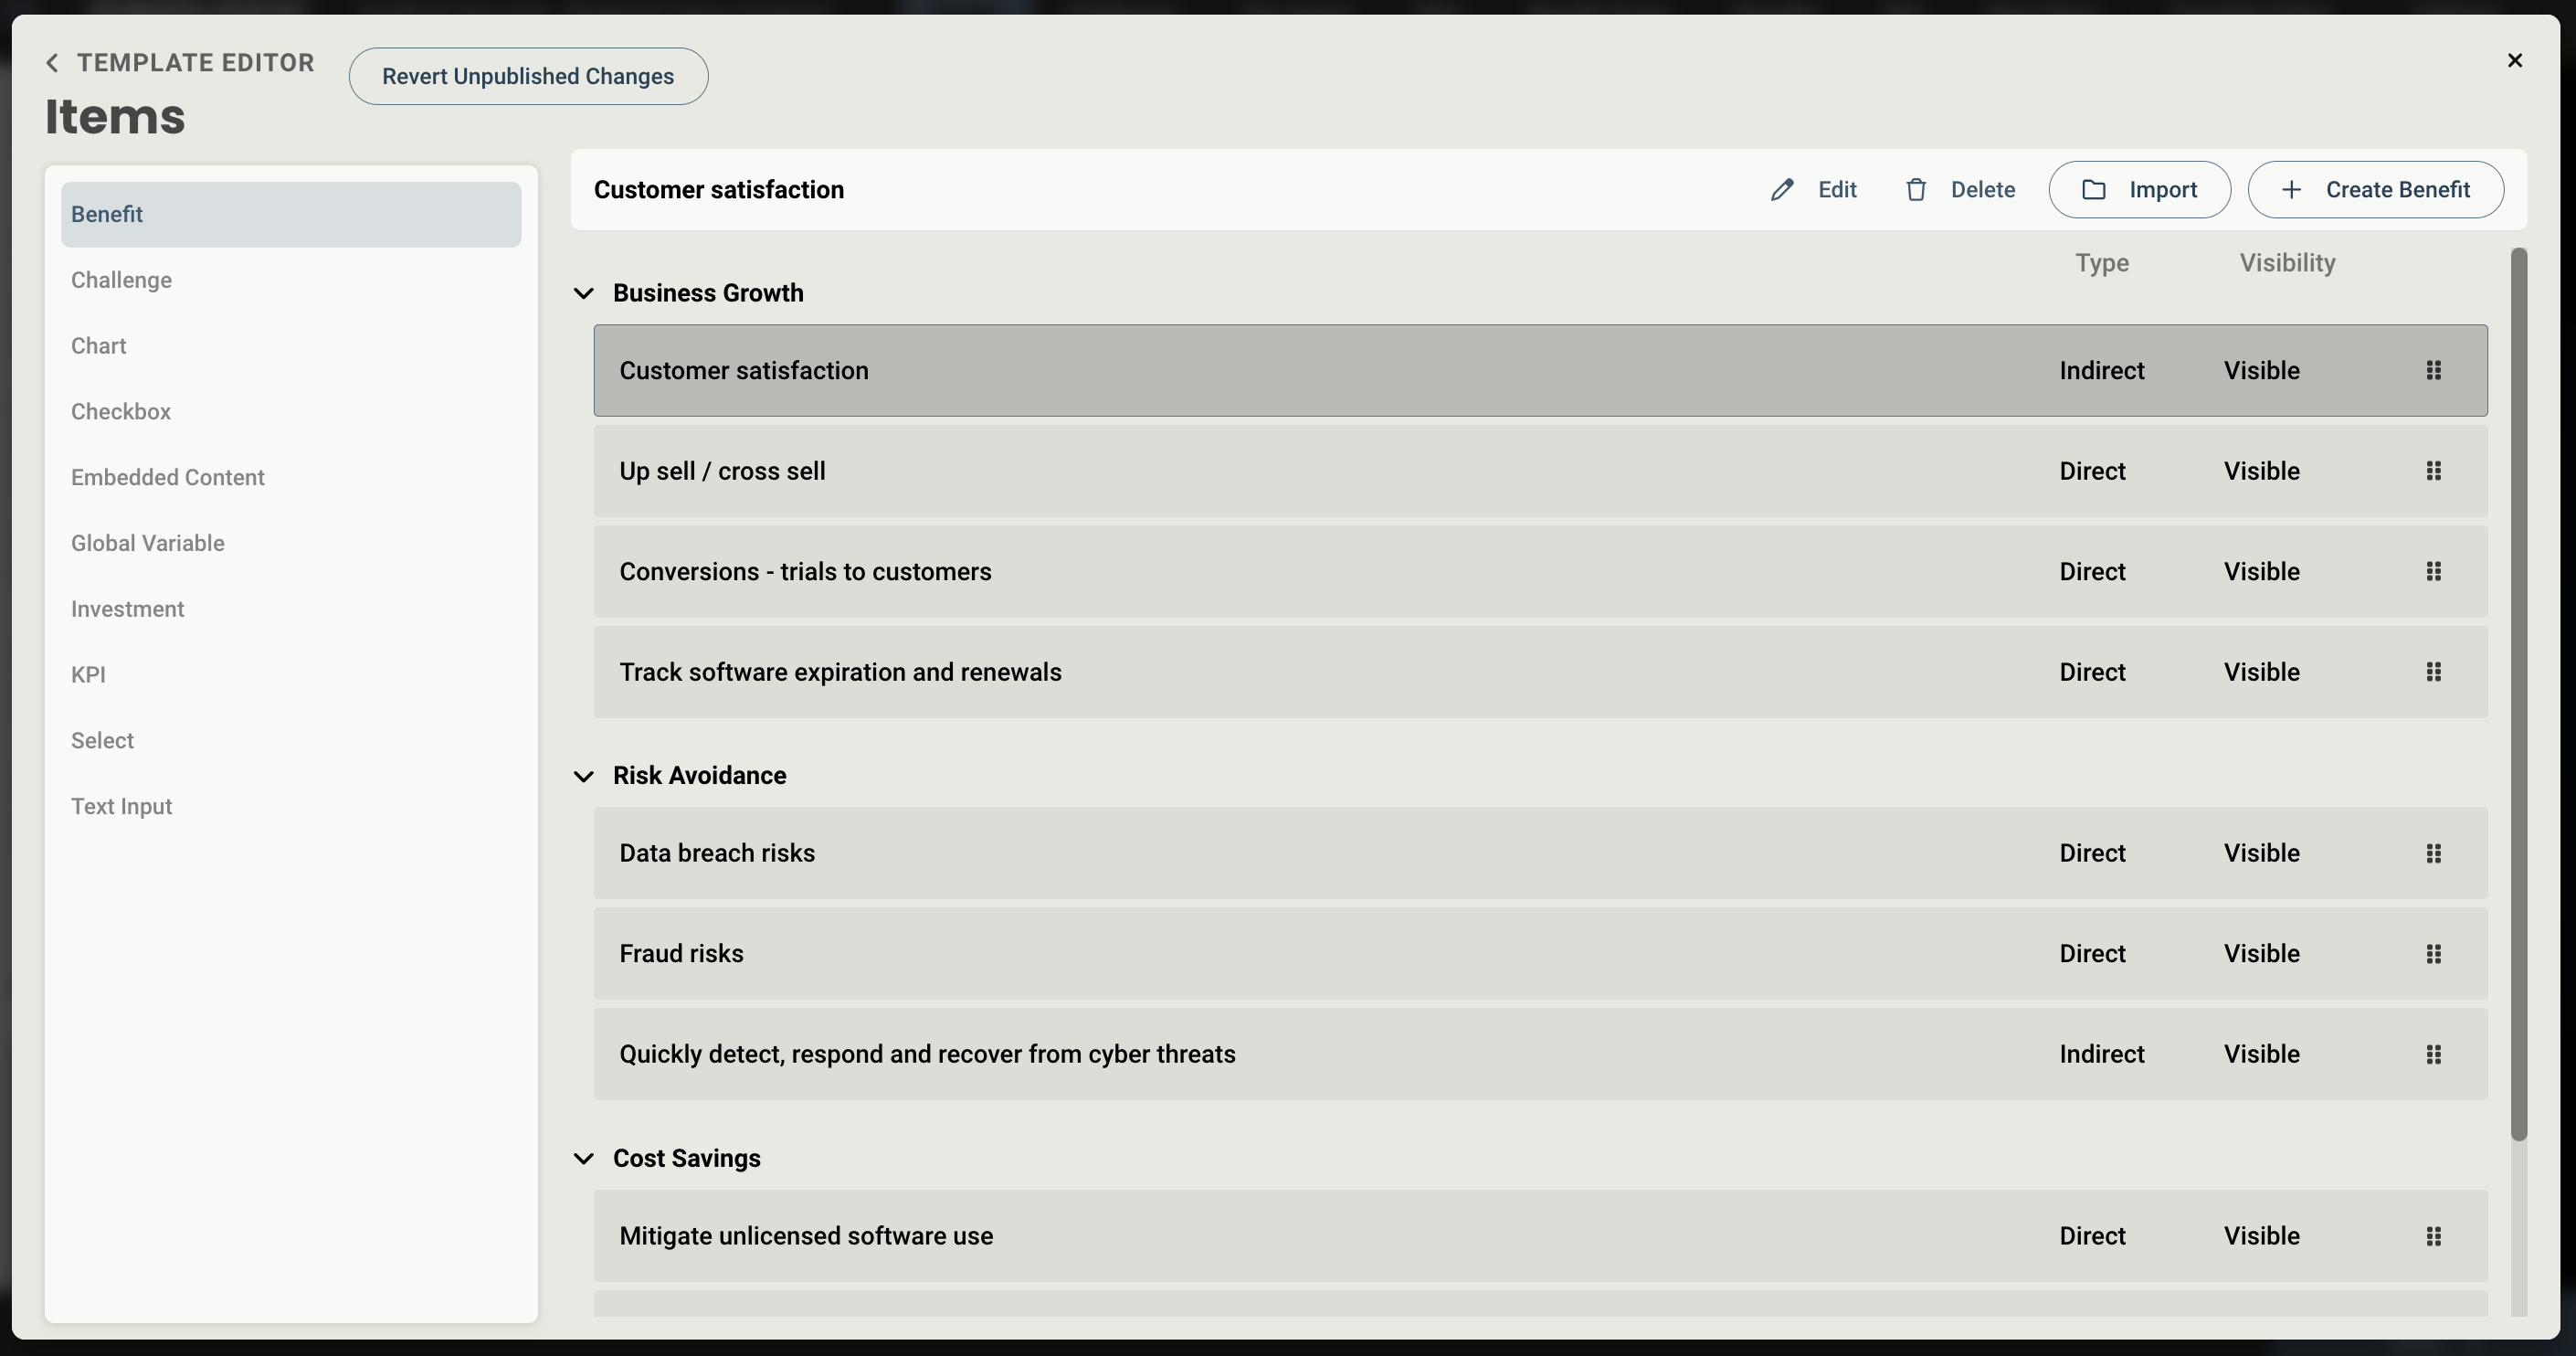
Here you have the option to add either Import a Benefit from the library, or Create a new one.
Adding from the library lets you select from those that your team has created, in addition to 100 pre-built Benefits provided by Mediafly. Default Benefits are marked by a small Mediafly logo on the left hand side.
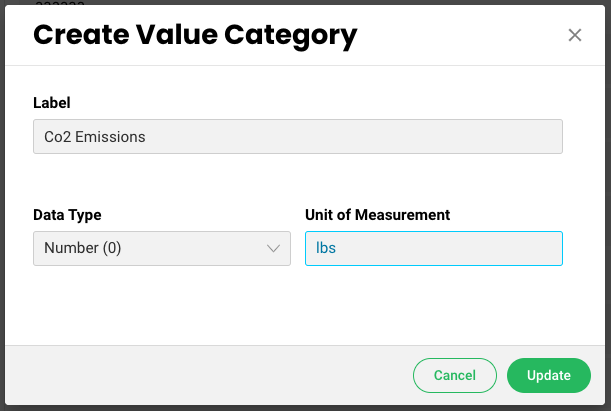
Authors have the ability to create financial Benefits, as well as those that may not have a monetary value. There are many benefits that are hard to quantify, such as training and development, or environmental impact. With non-monetary benefits, you can create your own values, assign a corresponding unit of measurement and format, and label it depending on your desired Value Category.
From the Benefits editor screen, you have four tabs on the left:
- Configuration
- Calculator builder
- Callout builder
- Calculator
- Realization
Configuration
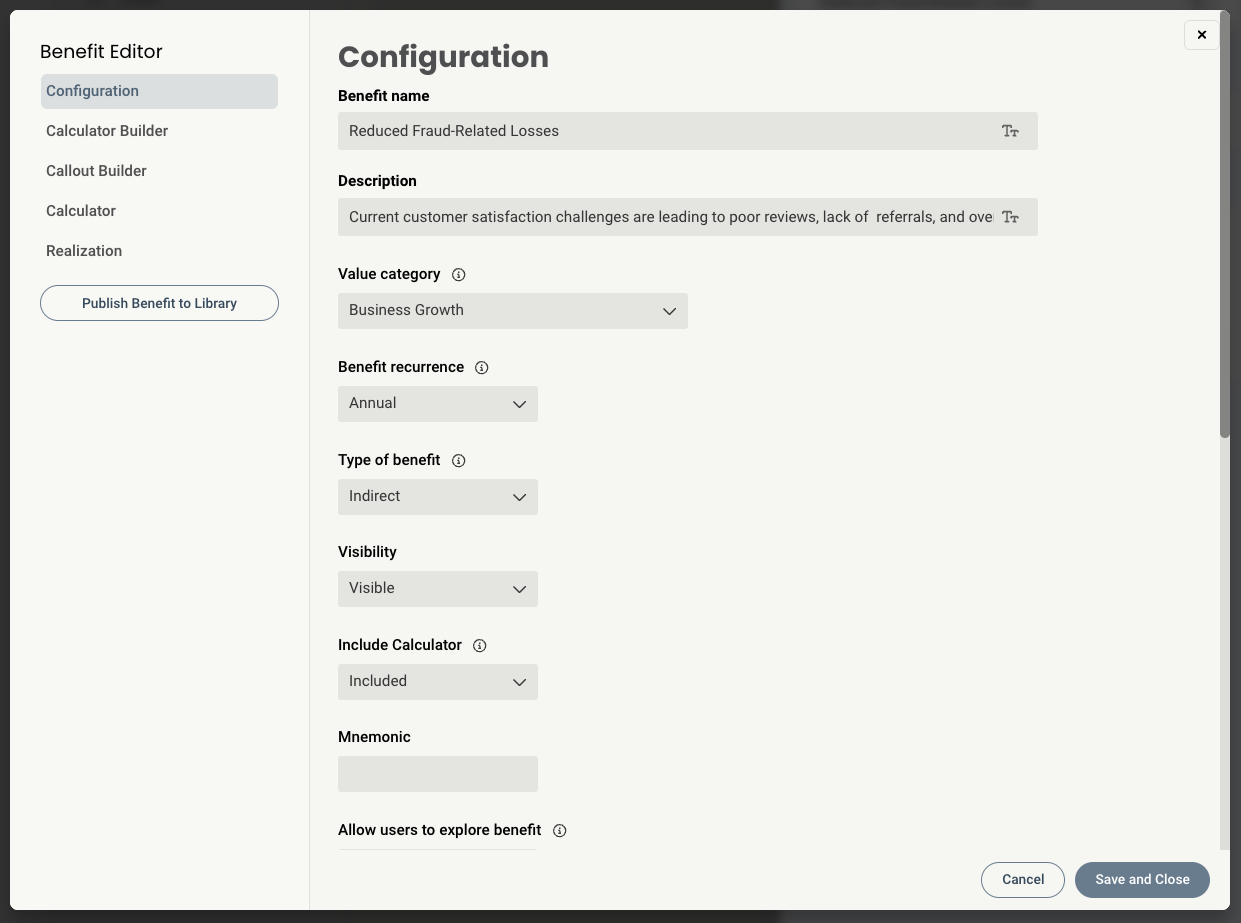
The Details tab lets the author set up basic information like title, description, text for Challenges and Benefits section. It also allows the author to set:
- Benefit Name/Description: Sets the label and description for the Benefit. These fields are rich text editors, so formatting/styling can be added to these sections, along with links to external websites/documents.
- Value category: The selection here sets the value category, such as cost avoidance, risk avoidance, productivity improvements, and growth. In fact, as you will see later, benefits will be specifically mapped into a specific Value Category, which will help in organization when you have lots of benefits available to you.
- Benefit Recurrence: This declares whether the benefit is seen every year throughout the analysis period (Annual), or only once (One-time). This difference will manifest in the Expected Benefits page of the tool. By default selecting One-time will default the benefit to be realized right at the start; to push this out to a later time, set the Time to deploy the proposed solution (in the Calculator tab > Realization modal) to something greater than 0 months, and this will shift the one-time benefit into later years. In this example below, the Downtime Customer Impact benefit is a One-Time benefit (with Time to deploy the proposed solution set to 0 months), whereas the Long Sales Cycle benefit is an Annual benefit.
- Type of benefit: By default the benefit is a Direct benefit and 100% of the value is captured in the analysis. If the author switches this to be an Indirect benefit, only 10% of the value is captured. These default values of 100%/10% can be adjusted in the Calculator tab > Realization dialog (and, in a future version, in the Administration section).
- Visibility: this option allows you to either show or hide the benefit within the tool depending on the specific business goals or tool's objectives.
- Report Mnemonic: a mnemonic can be assigned to any custom item in the tool. These are added to reports to pull in that particular piece of information.
- Allow user to explore Benefit - this lets a user dive into each Benefit on the Expected Benefits page in order to view the Challenge/Benefit text and Calculator
- Allow users to toggle benefit inclusion - this shows or hides the checkbox on the benefit that allows a user to include it in their analysis results
- Icon: this is the icon that is mapped to this benefit.
- Challenges Text and Benefits Text: this text appears when the end user chooses to Explore a benefit from the Benefit Scope page, like this.
Calculator Builder
The Calculator Builder tab lets the author configure the benefit and how it's calculated. On the top, you can add and configure inputs that make up the benefit.
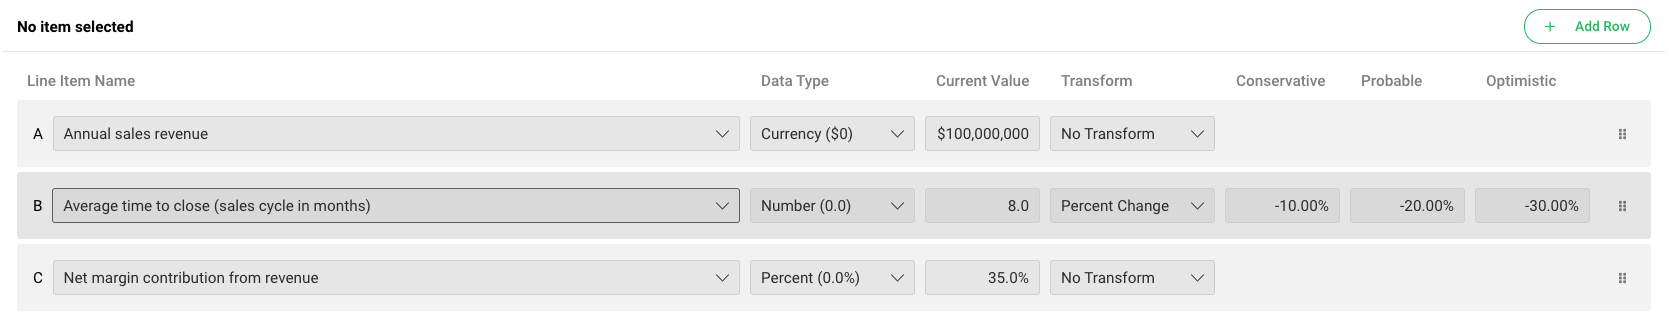
- Line Item Name: the name of the input that feeds into the calculation
- Data Type: what kind of input this is
- Current Value: the default value presented to the end user in the tool
-
Transform: This defines how your Current Value will be adjust for each of your views (Conservative, Probable, Optimistic) when the end user switches to a different view.
- If Absolute Value is chosen, the three views field can be filled with a scalar value.
-
If Percent Change is chosen, enter a percentage by which the Current Value is affected.
- For example, in Line Item A above, when the end user chooses the Probable projection, the benefit will show a 20% reduction in the number of documents printed per month.
-
If Additive is chosen, the impact will be added directly to the current value
- For example, say I have a 120% current value and I want to add 25%% impact. The result would be 145%, instead of 156% (result of 120% plus 25% of 120%)
- If No Transform is chosen, the Views fields will disappear.
- Conservative / Probable / Optimistic: this defines the amount the Current Value is impacted for the given view over each year. Note: as you enter values, you can see the impact against the Current Value in the Impact Summary section, bottom right.
- Convert to Global: for any given input, you can change this to a global variable. When it is marked as a global, the input will appear on the Key Inputs page and will be entered once for all benefits that share the same name. When you enter a Line Item Name, the system checks against all other Line Item Names, and if it finds another with the same name that is already marked as a Global variable, this one will also be marked as a Global variable automatically
- Trash icon: use this to delete a row
- Move/drag handle: use this to reorder the rows in the calculator
The bottom half lets you set up the formula that computes the value of the benefit.
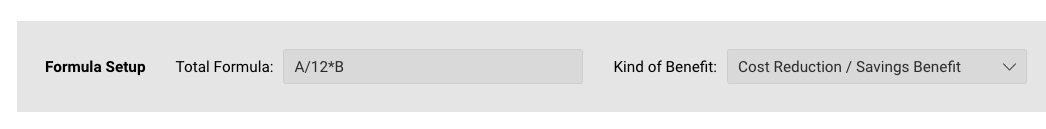
- Total Formula: enter the formula used to calculate the benefit. The variables are defined by the row order
- Kind of Benefit: most benefits are cost reductions/savings benefits. This means that, by adopting the product or service, the company will save money. The other kind of benefit is a growth benefit. A growth benefit inverts the impact of the percentages in the Conservative / Probable / Optimistic views above. For example, if we switched the above benefit to be a growth benefit but did not change the percentages, we would see the Impact Summary of Year 1 for the Conservative view switch from -$11,592 to (positive) $11,592
Note - to give end users access to create their own Benefits, select a Template from the library and enable it from Properties. Users will not be able to publish these Benefits to the library without Author access.
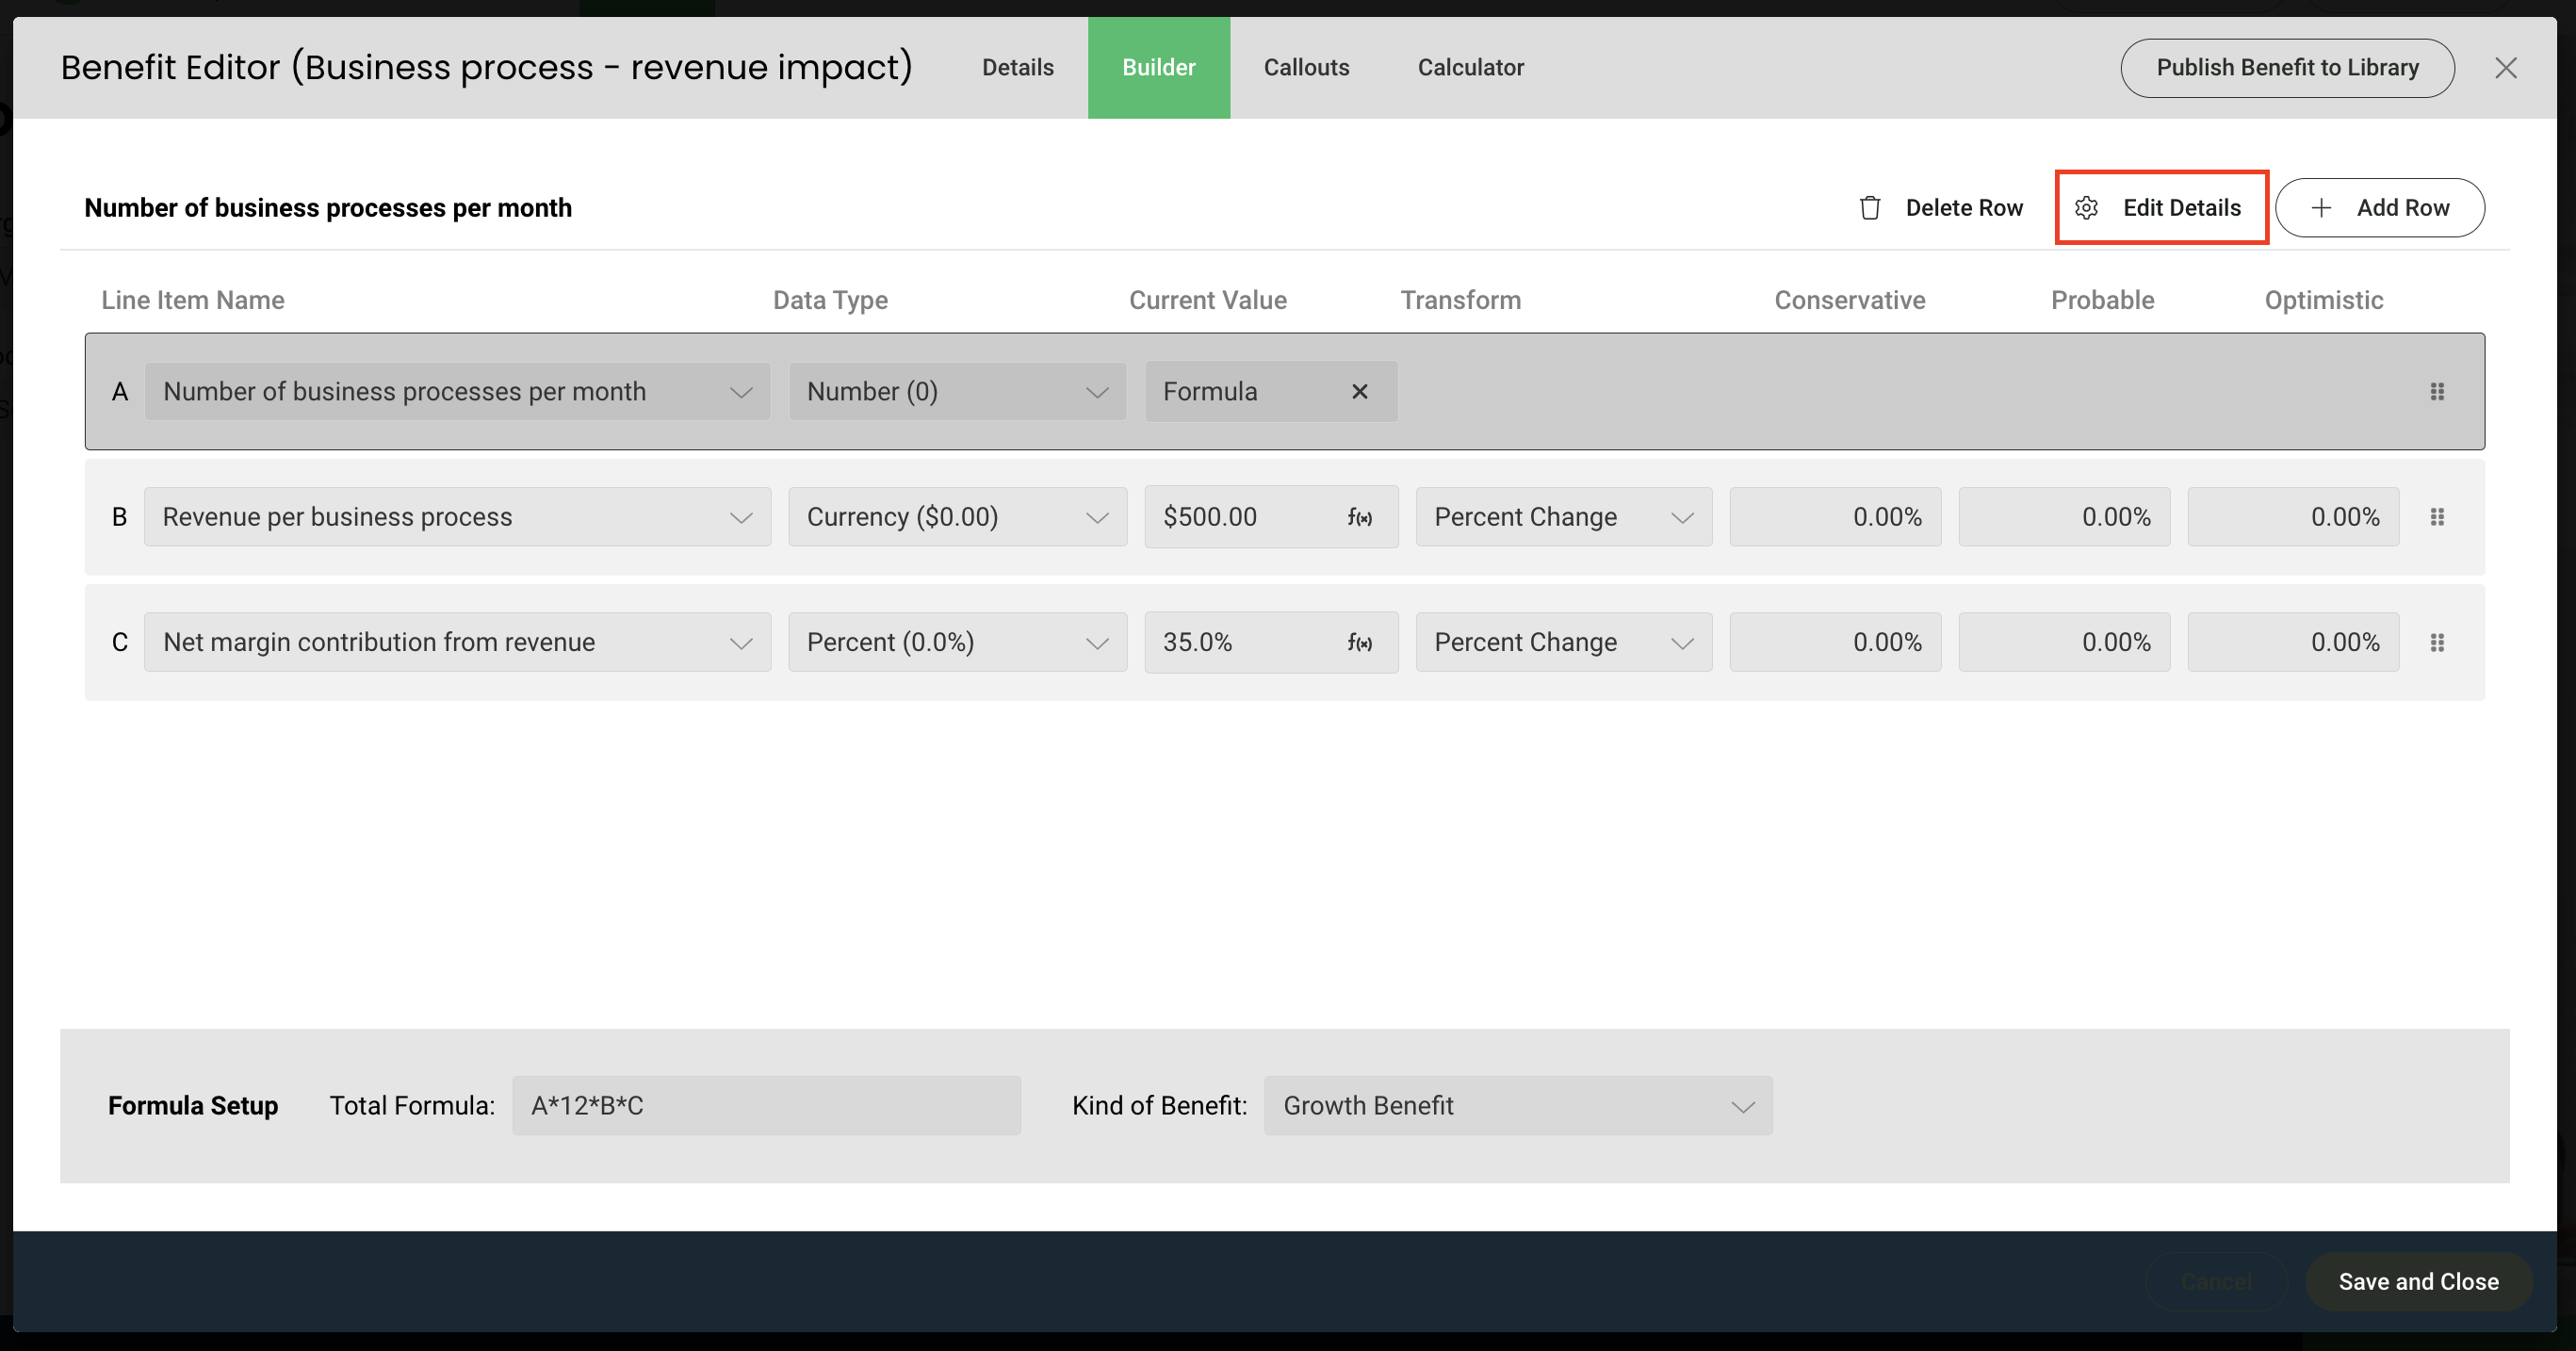
Benefit Sub-calculations
Authors can create sub calculations between individual line items in the Calculator Builder tab. This is especially useful if you would like to exclude certain global variables from being reflected in the primary calculation, or highlight the result of two particular variables in a callout.
Here’s how it works:
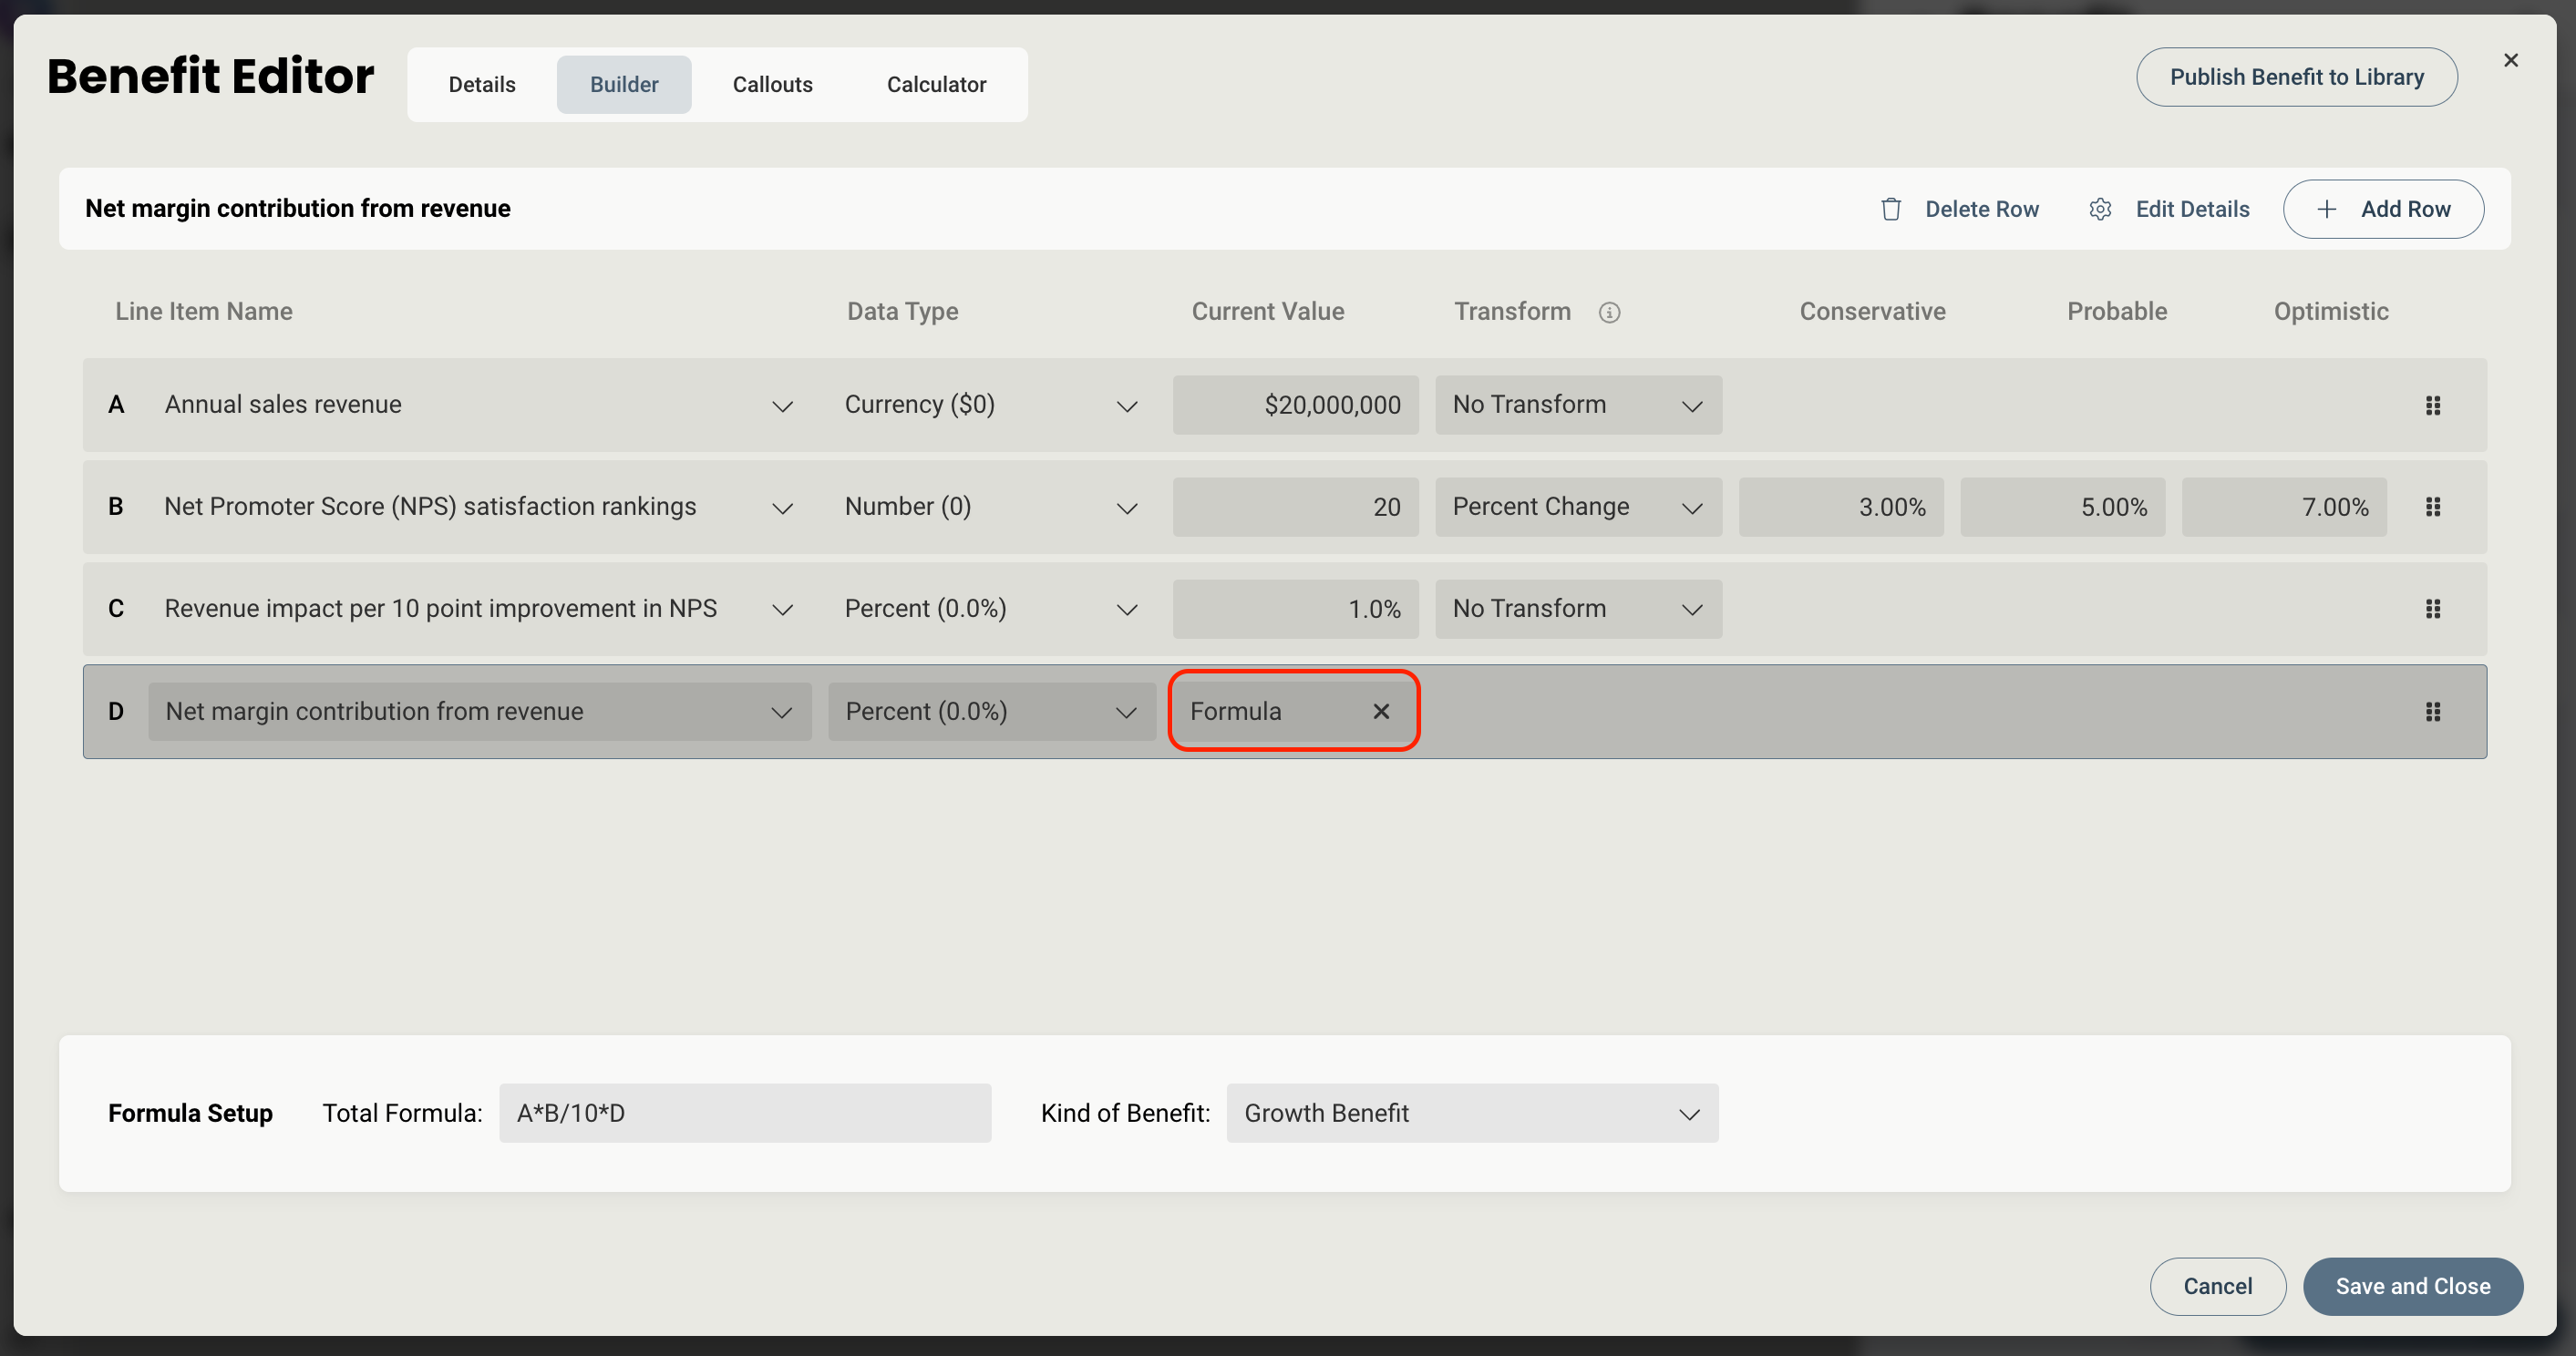
- In each line item in the builder tab, you will see a small formula icon in the Current Value field.
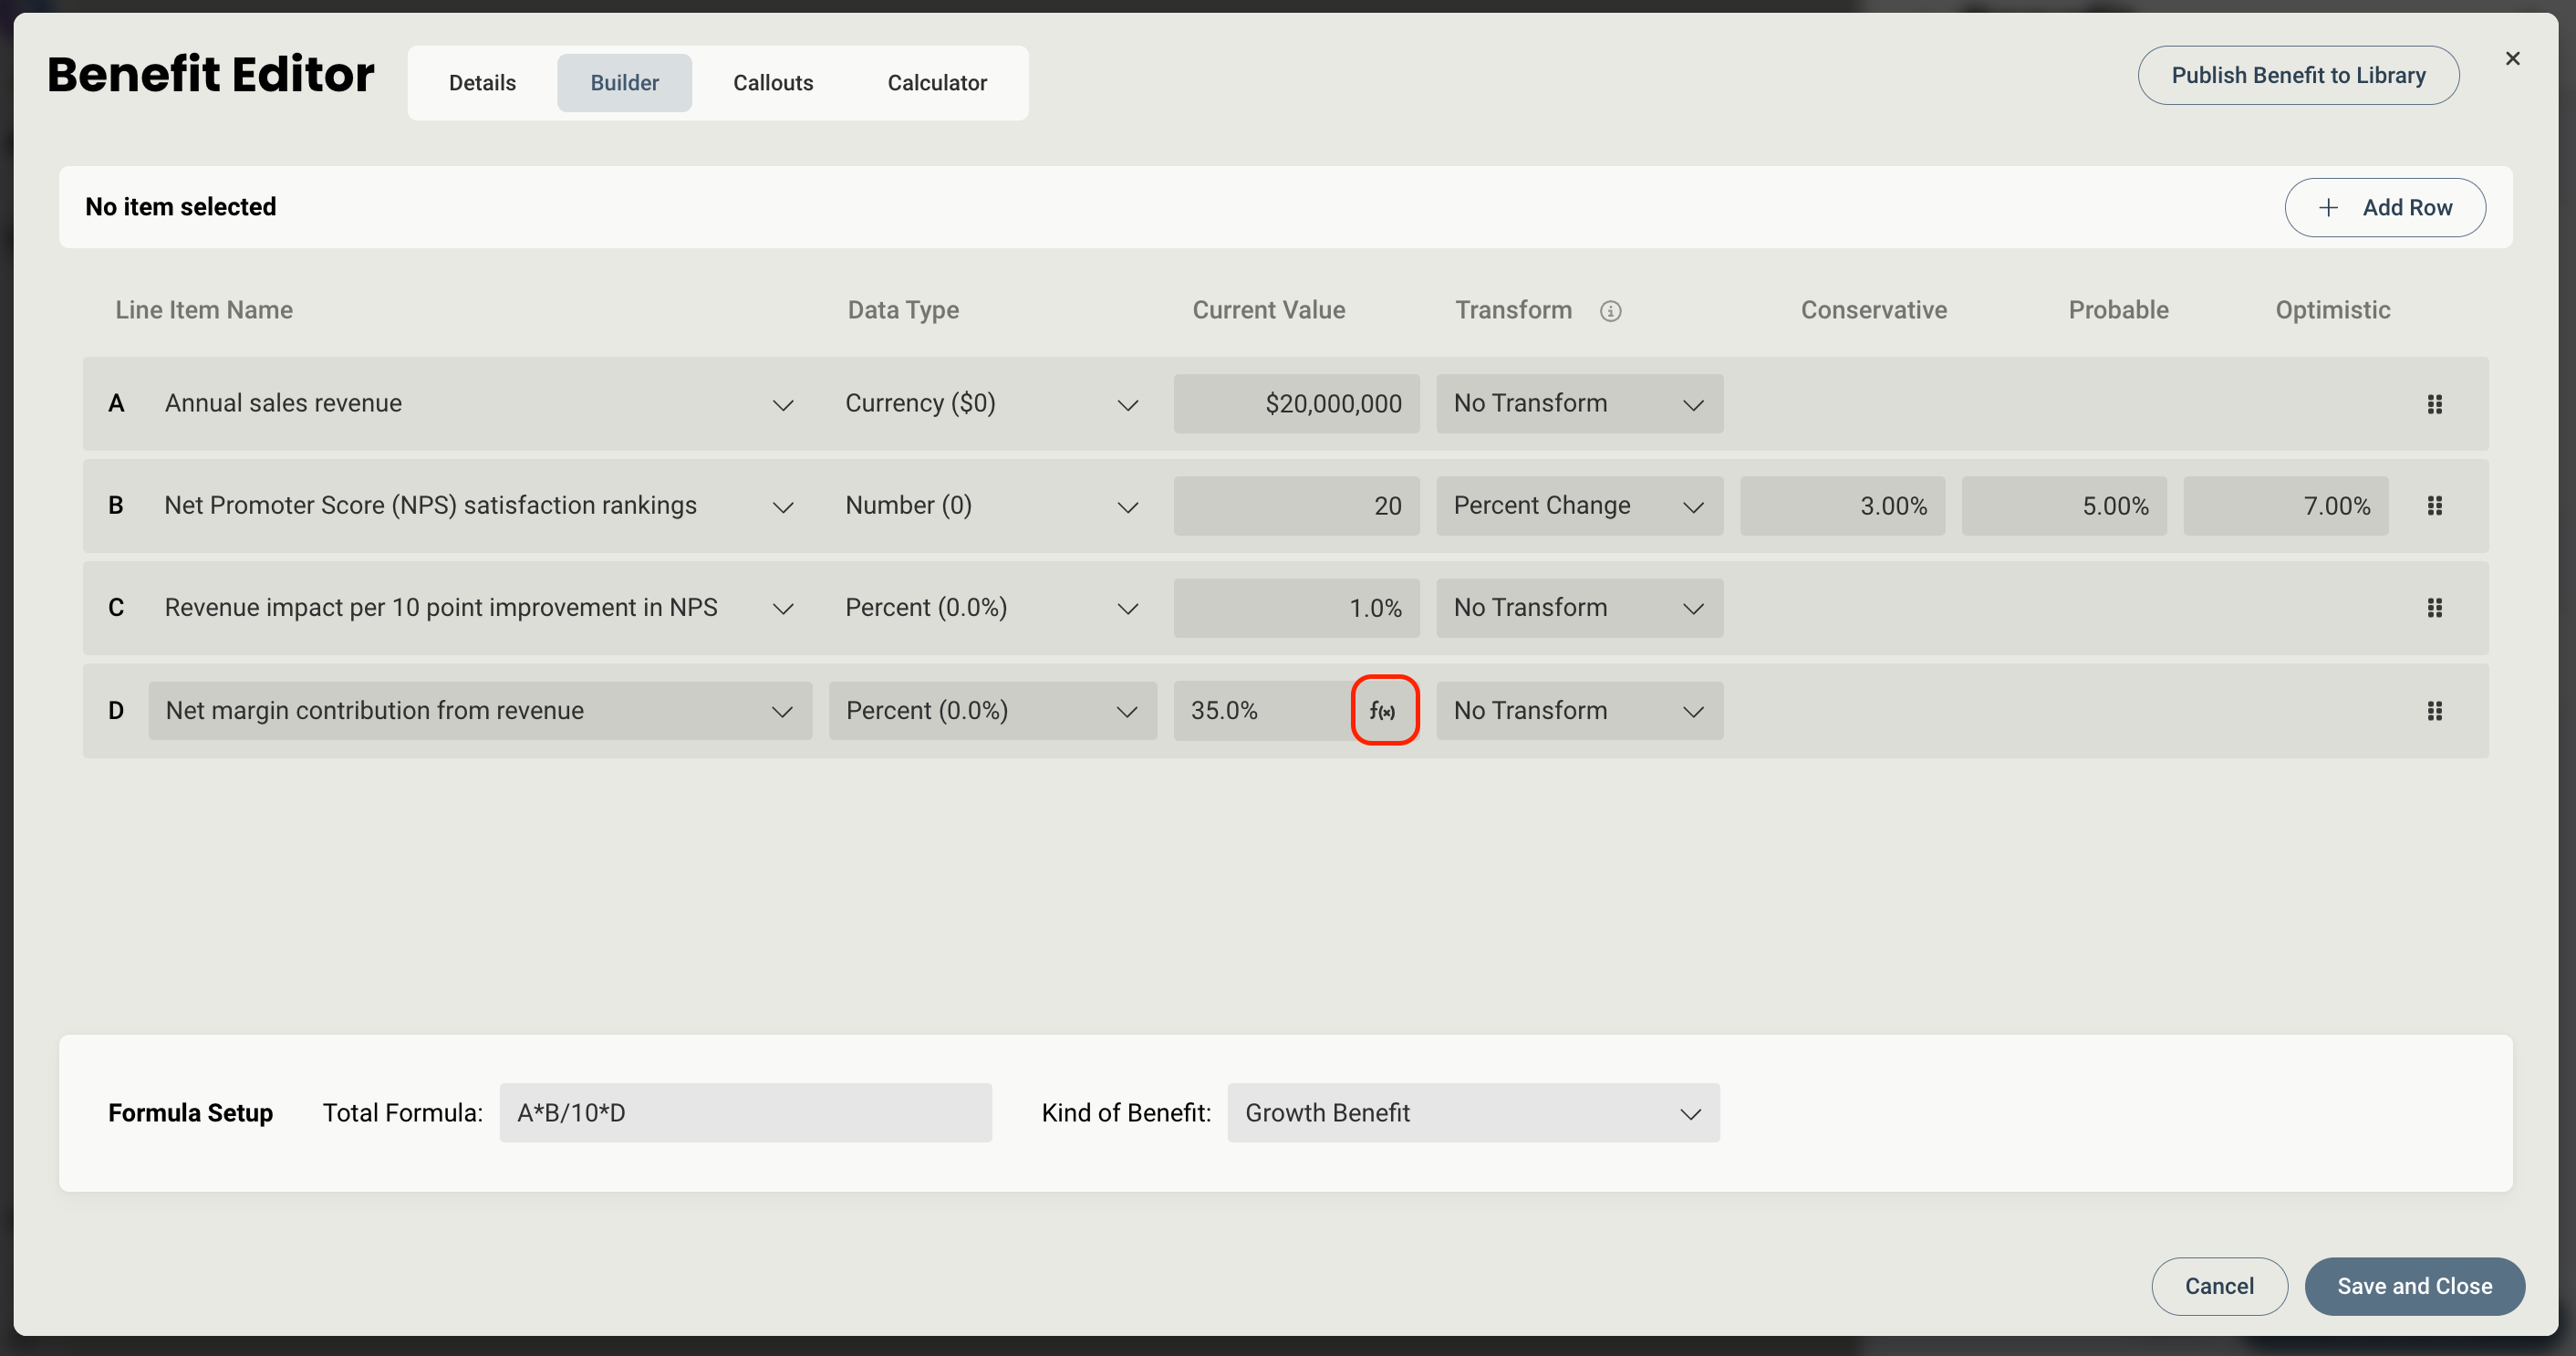
- Upon clicking this icon, a new modal will appear that allows you to create a formula by referencing other line items from the benefit. This works similar to how global and rule calculations work. In the below example, we have chosen to set the value of Number of Business Processes per Month to the result of B multiplied by C.
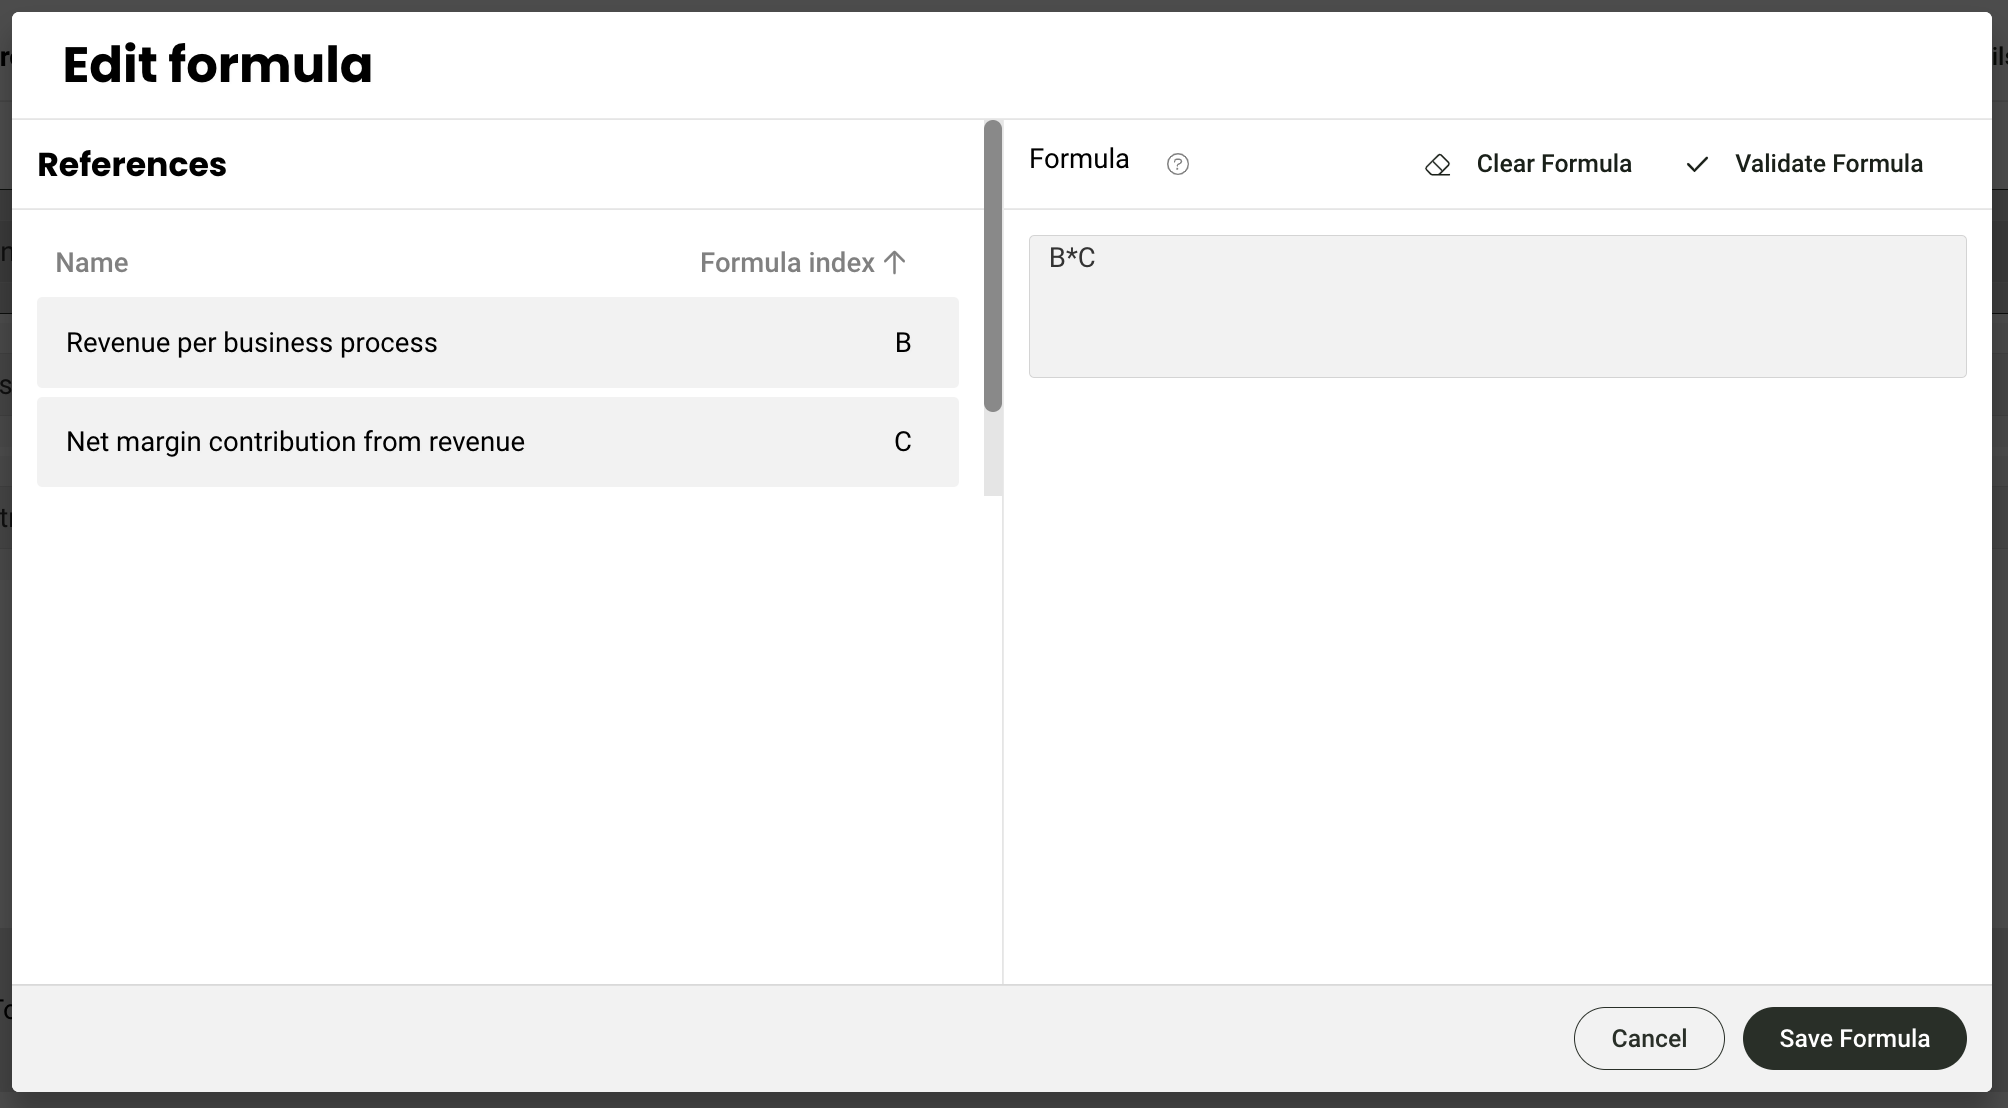
- The field is replaced with the word formula that indicates it’s being represented by a calculation of two line items.
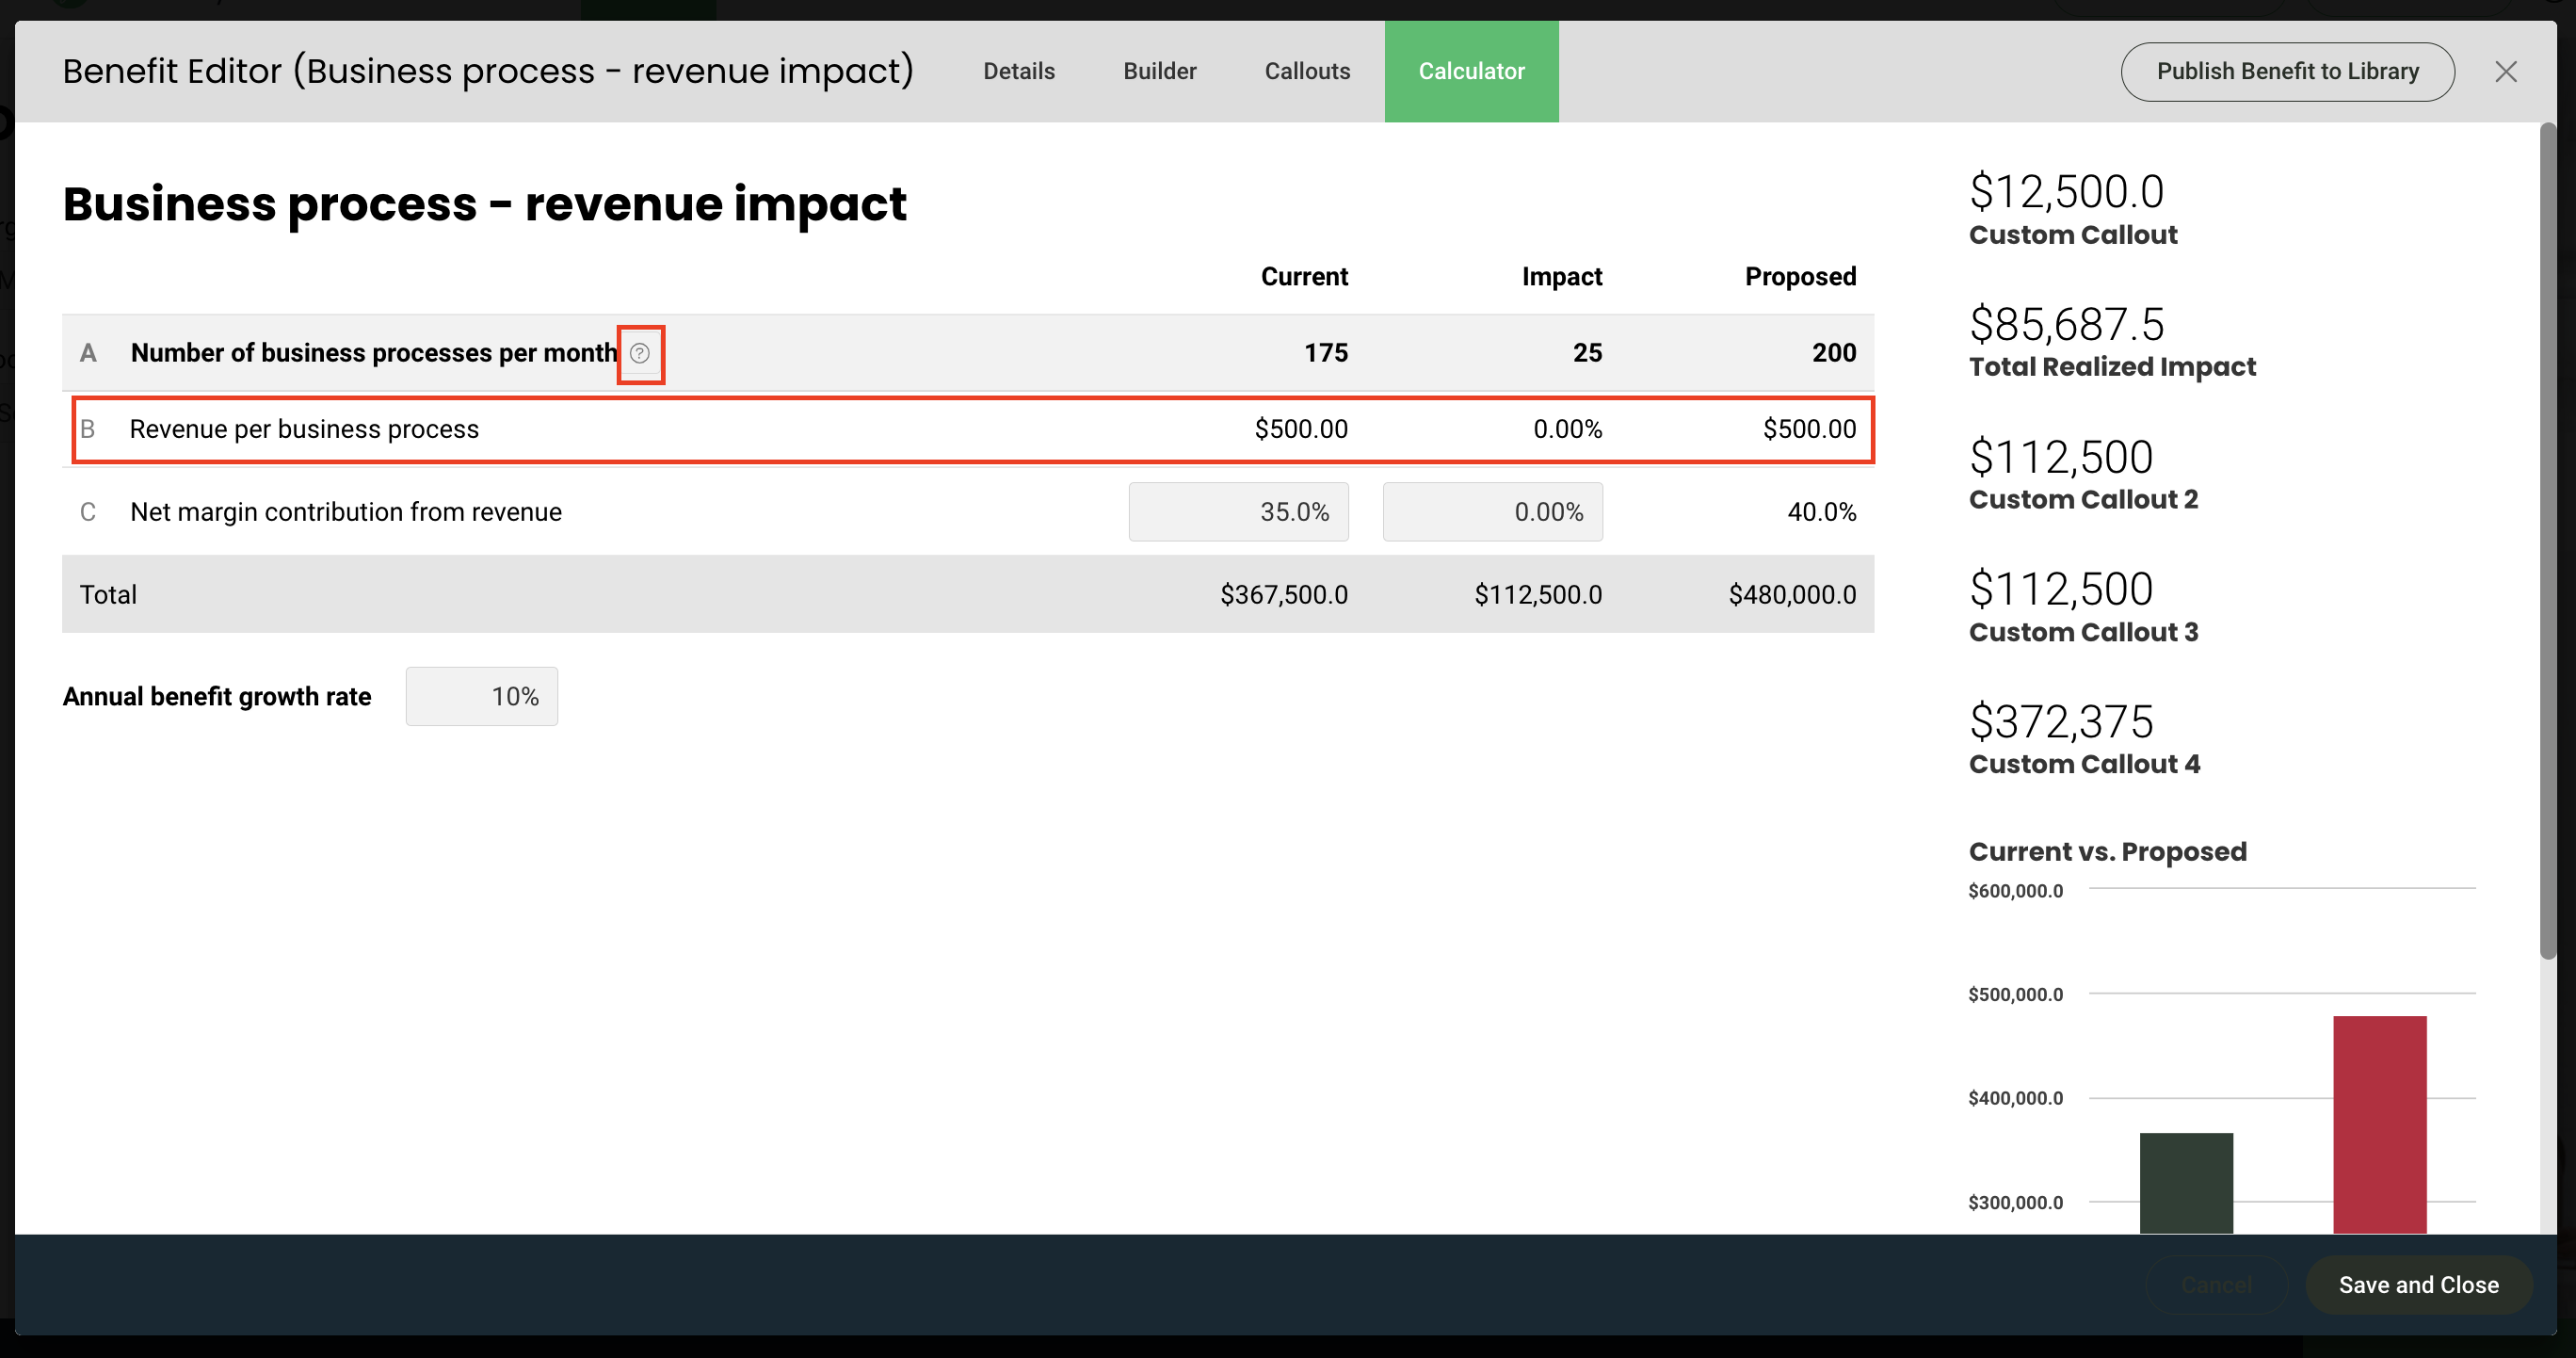
- If we go to the calculator tab, you can now see that row is showing a newly added sub-calculation
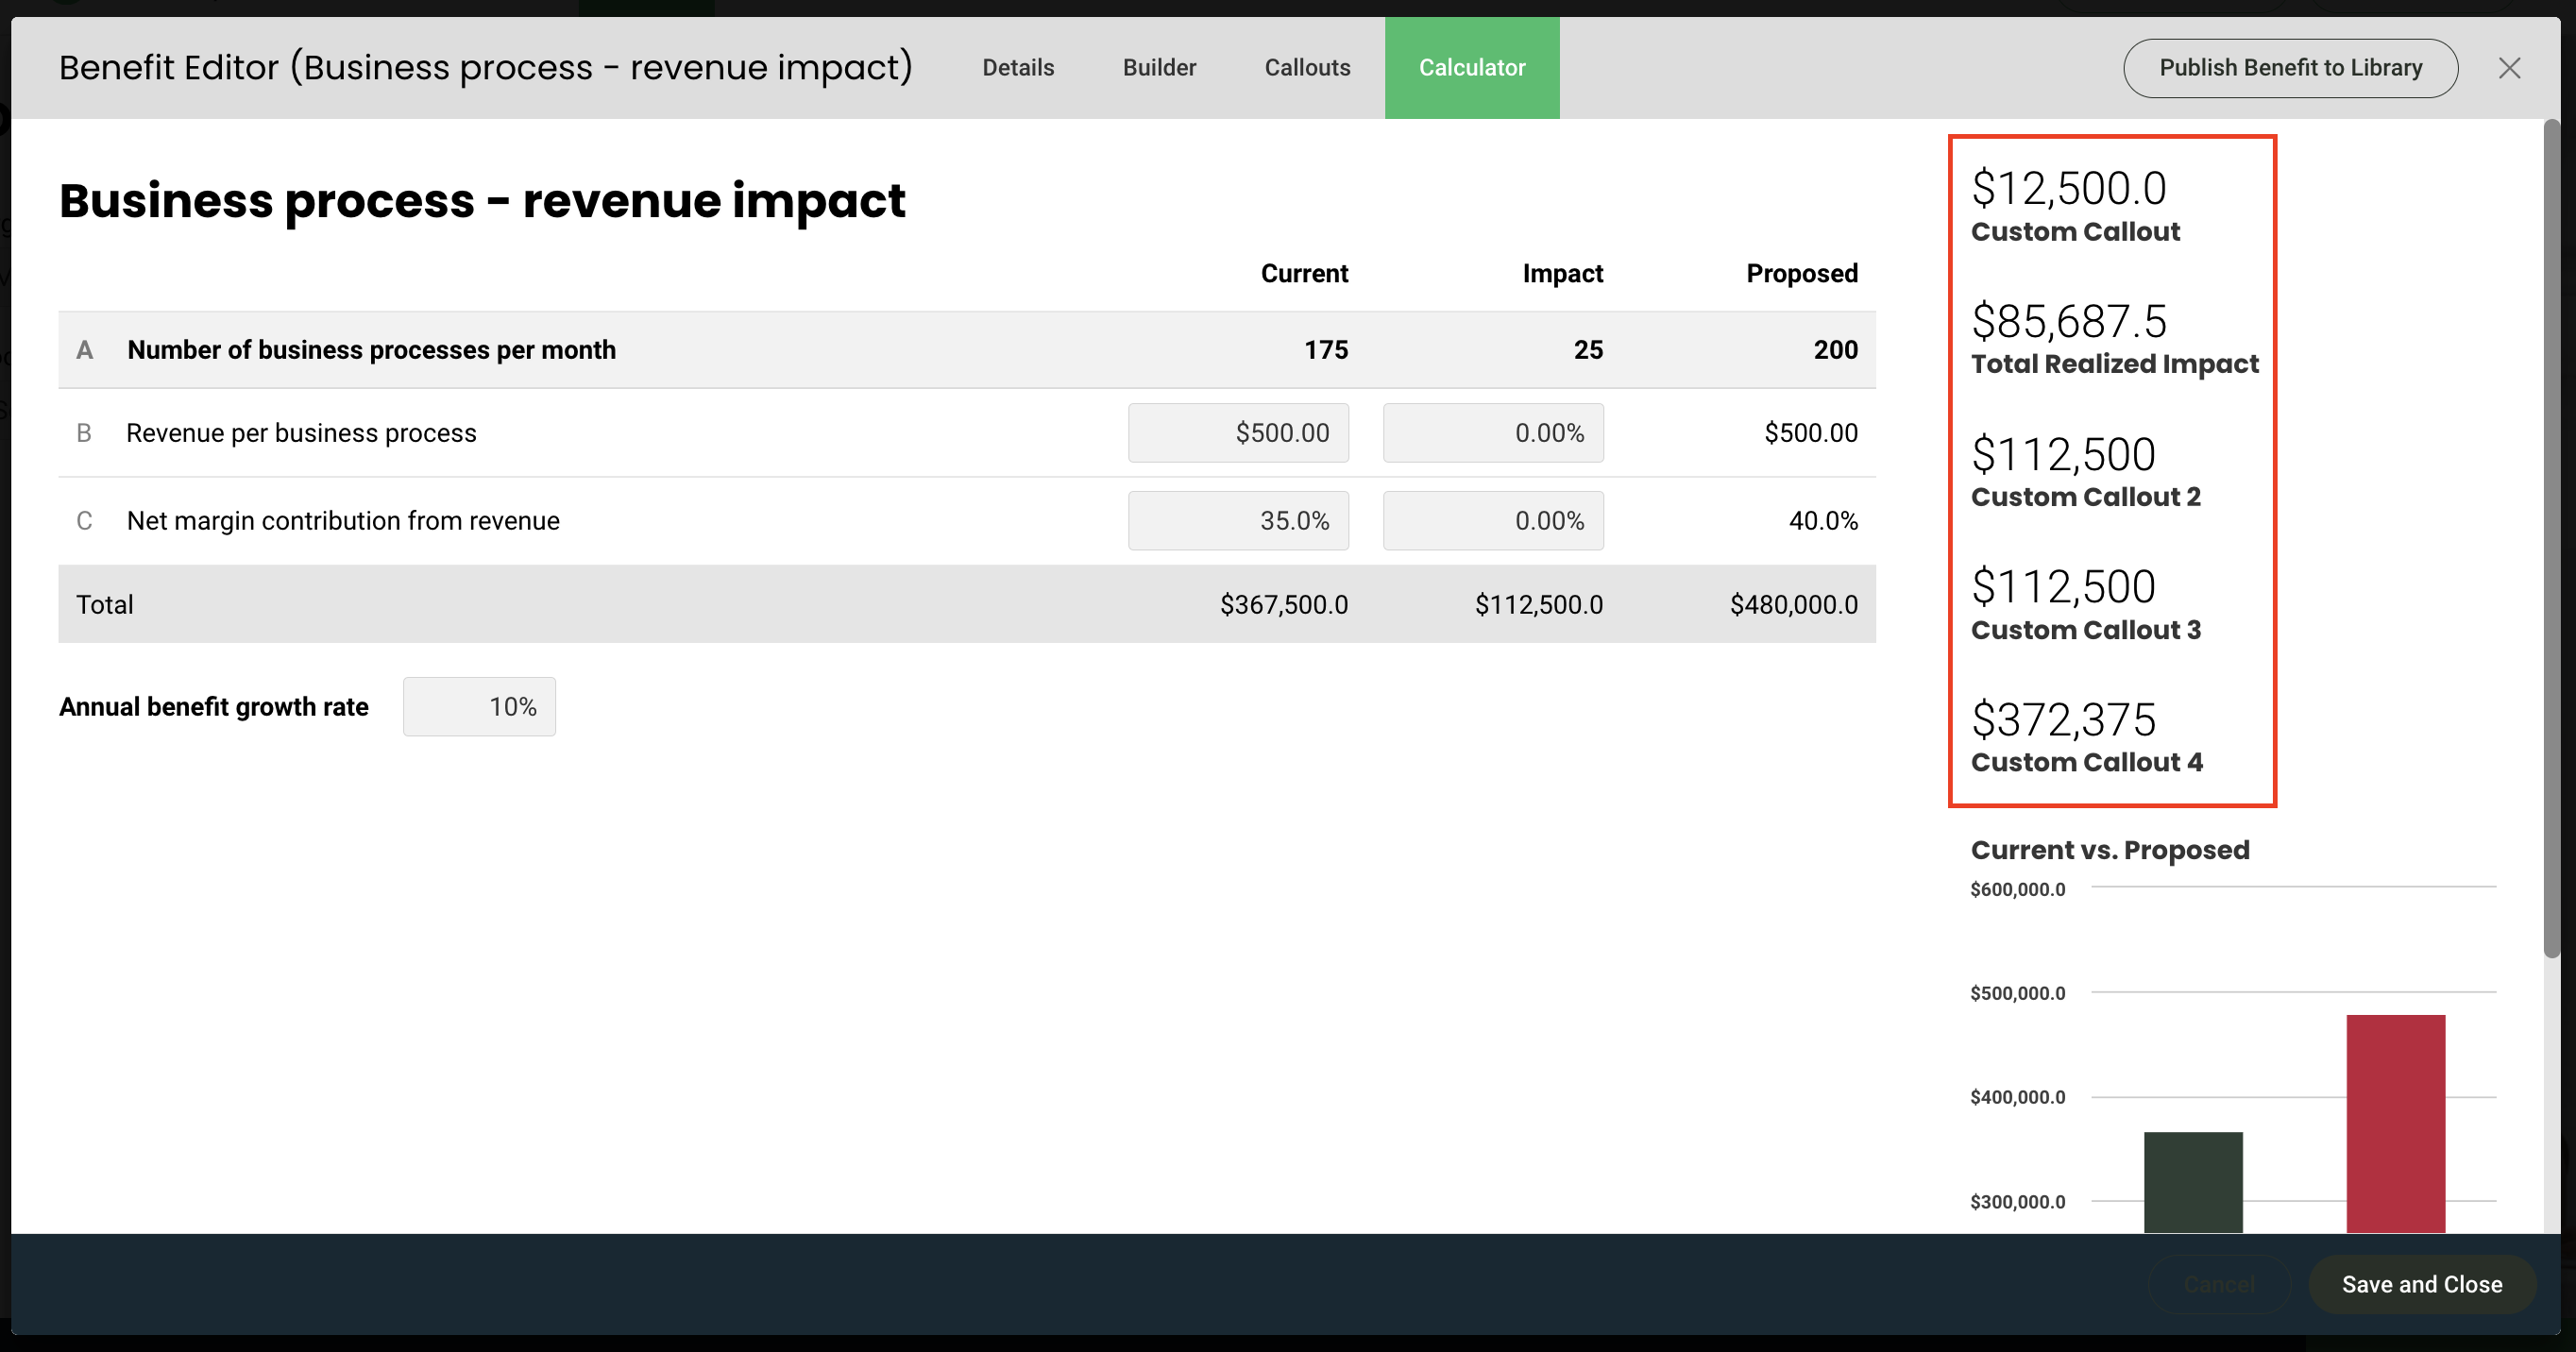
Callout Builder
Callouts can also be customized, and you are able to add as many as you’d like. These are the metrics like Total Ideal Impact or Annual Realized Benefits displayed on the Calculator tab. These are useful if you’d like to expand on the metrics you have displayed, or want to create unique callouts specific to your organization.
- If you open the Benefit Editor, the Callout Builder tab on the left allows you to edit existing callouts, or create and add new ones.
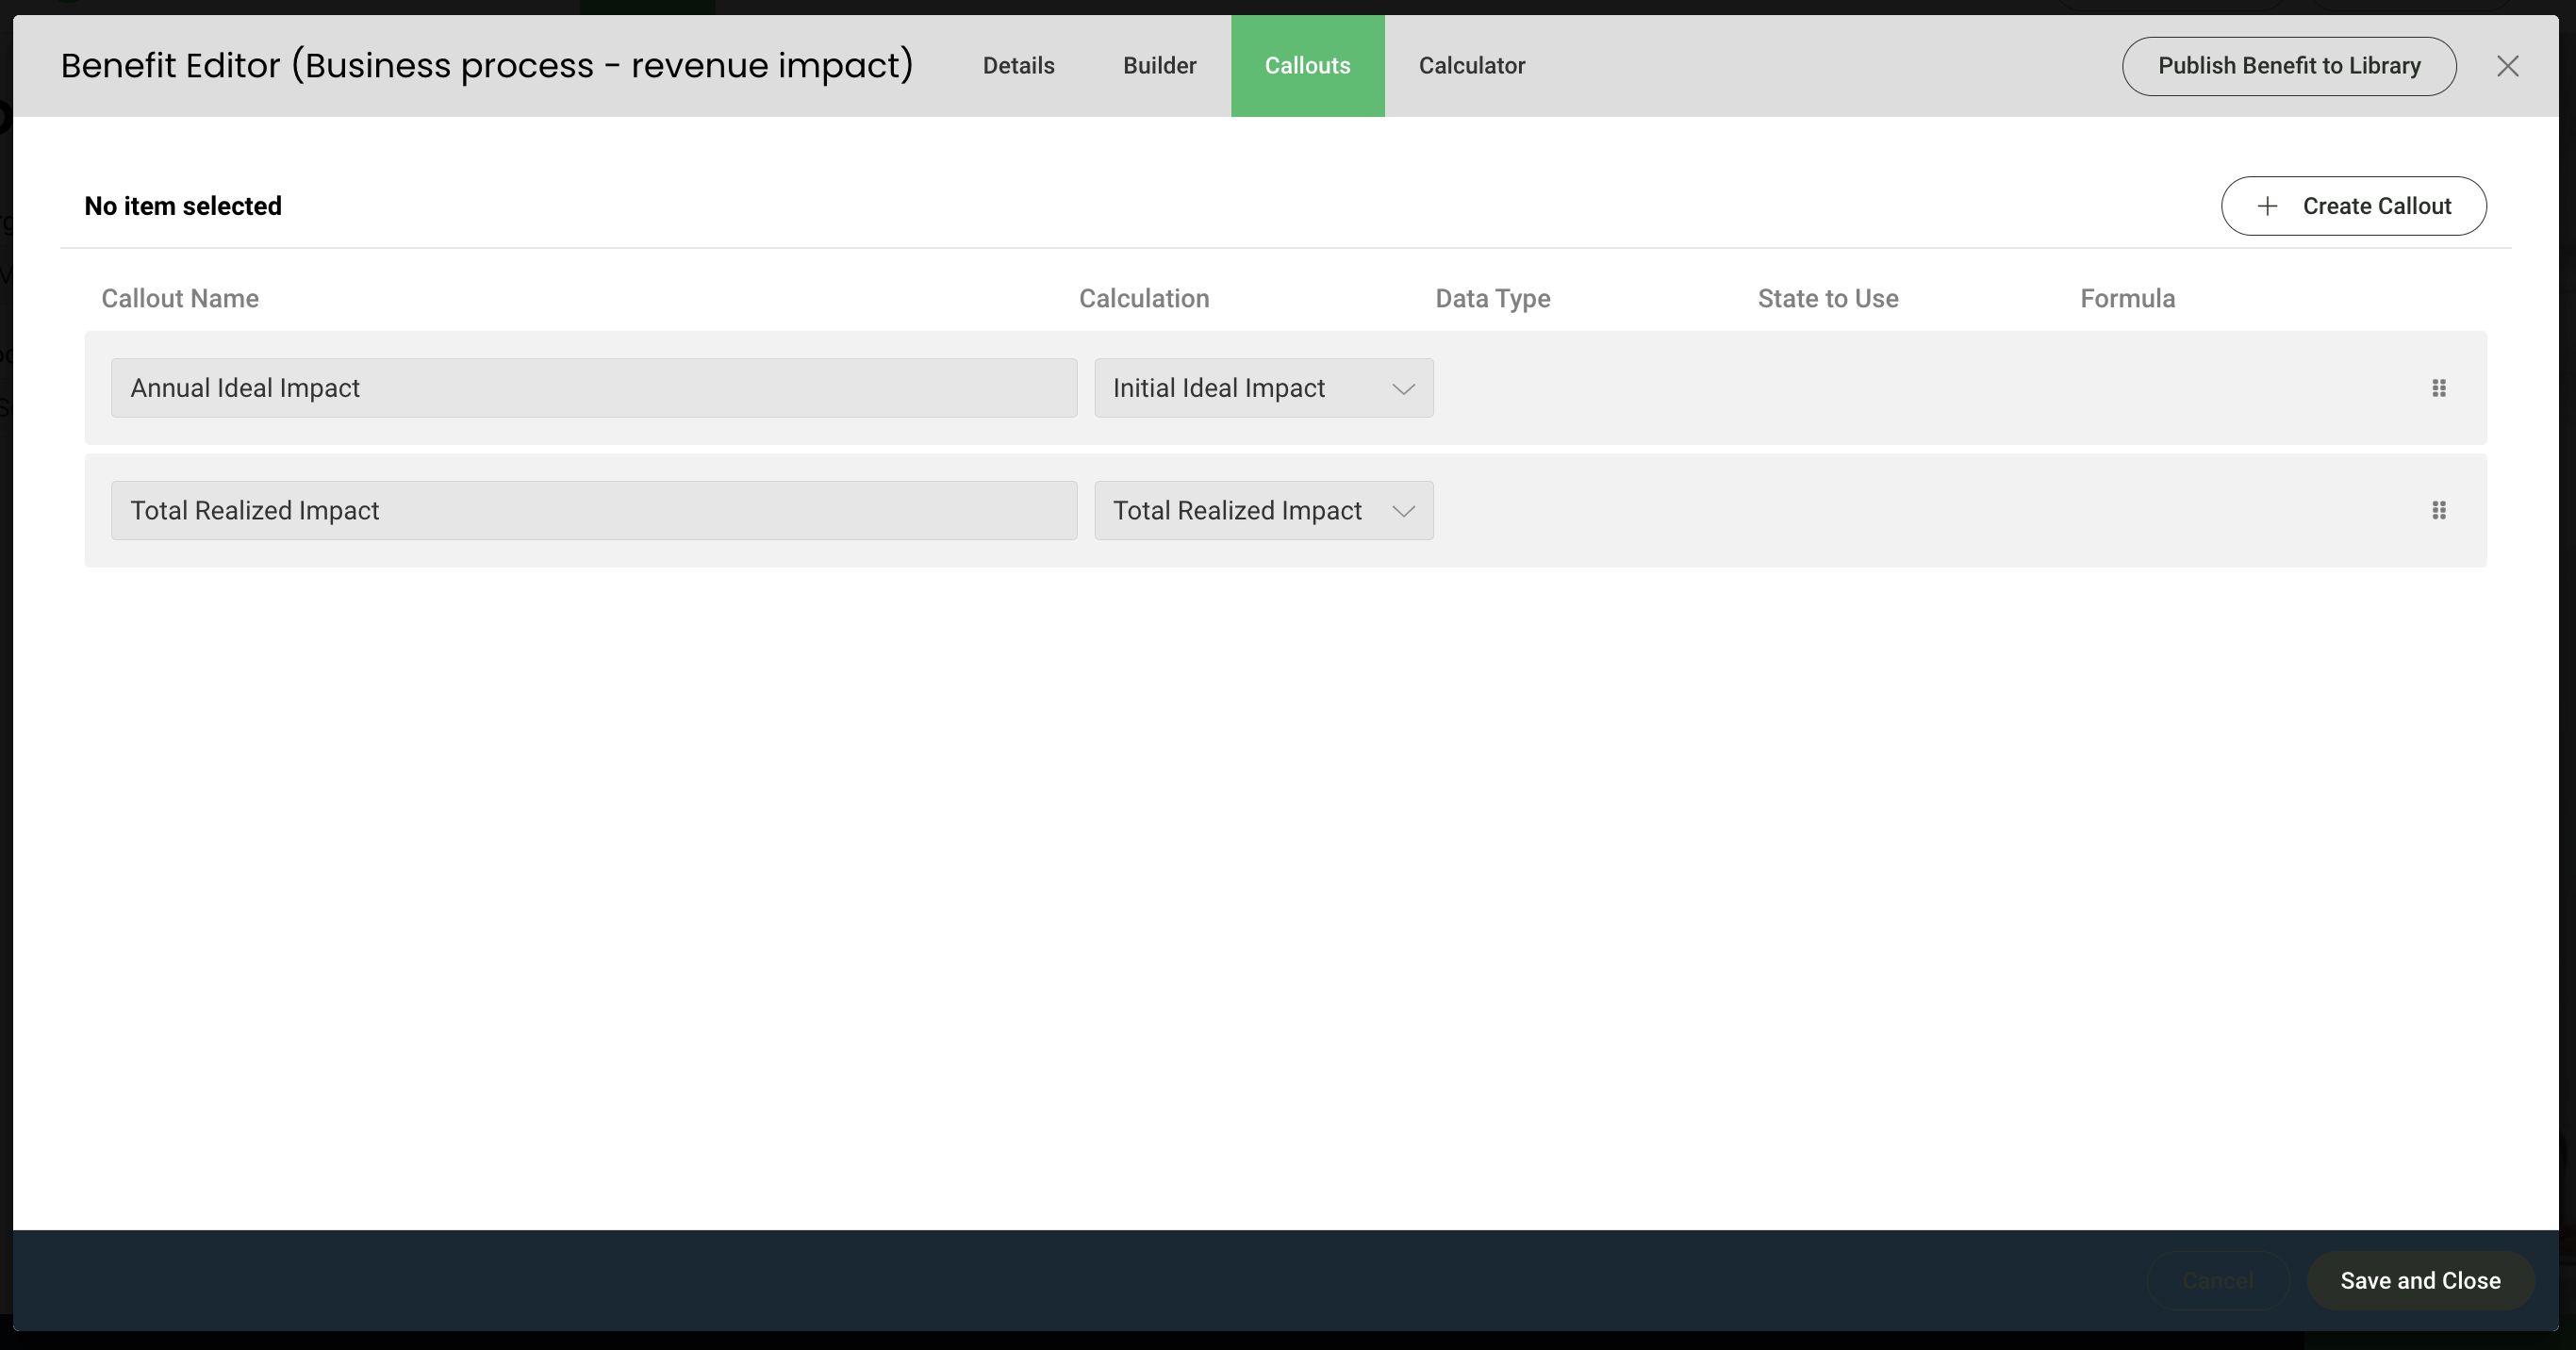
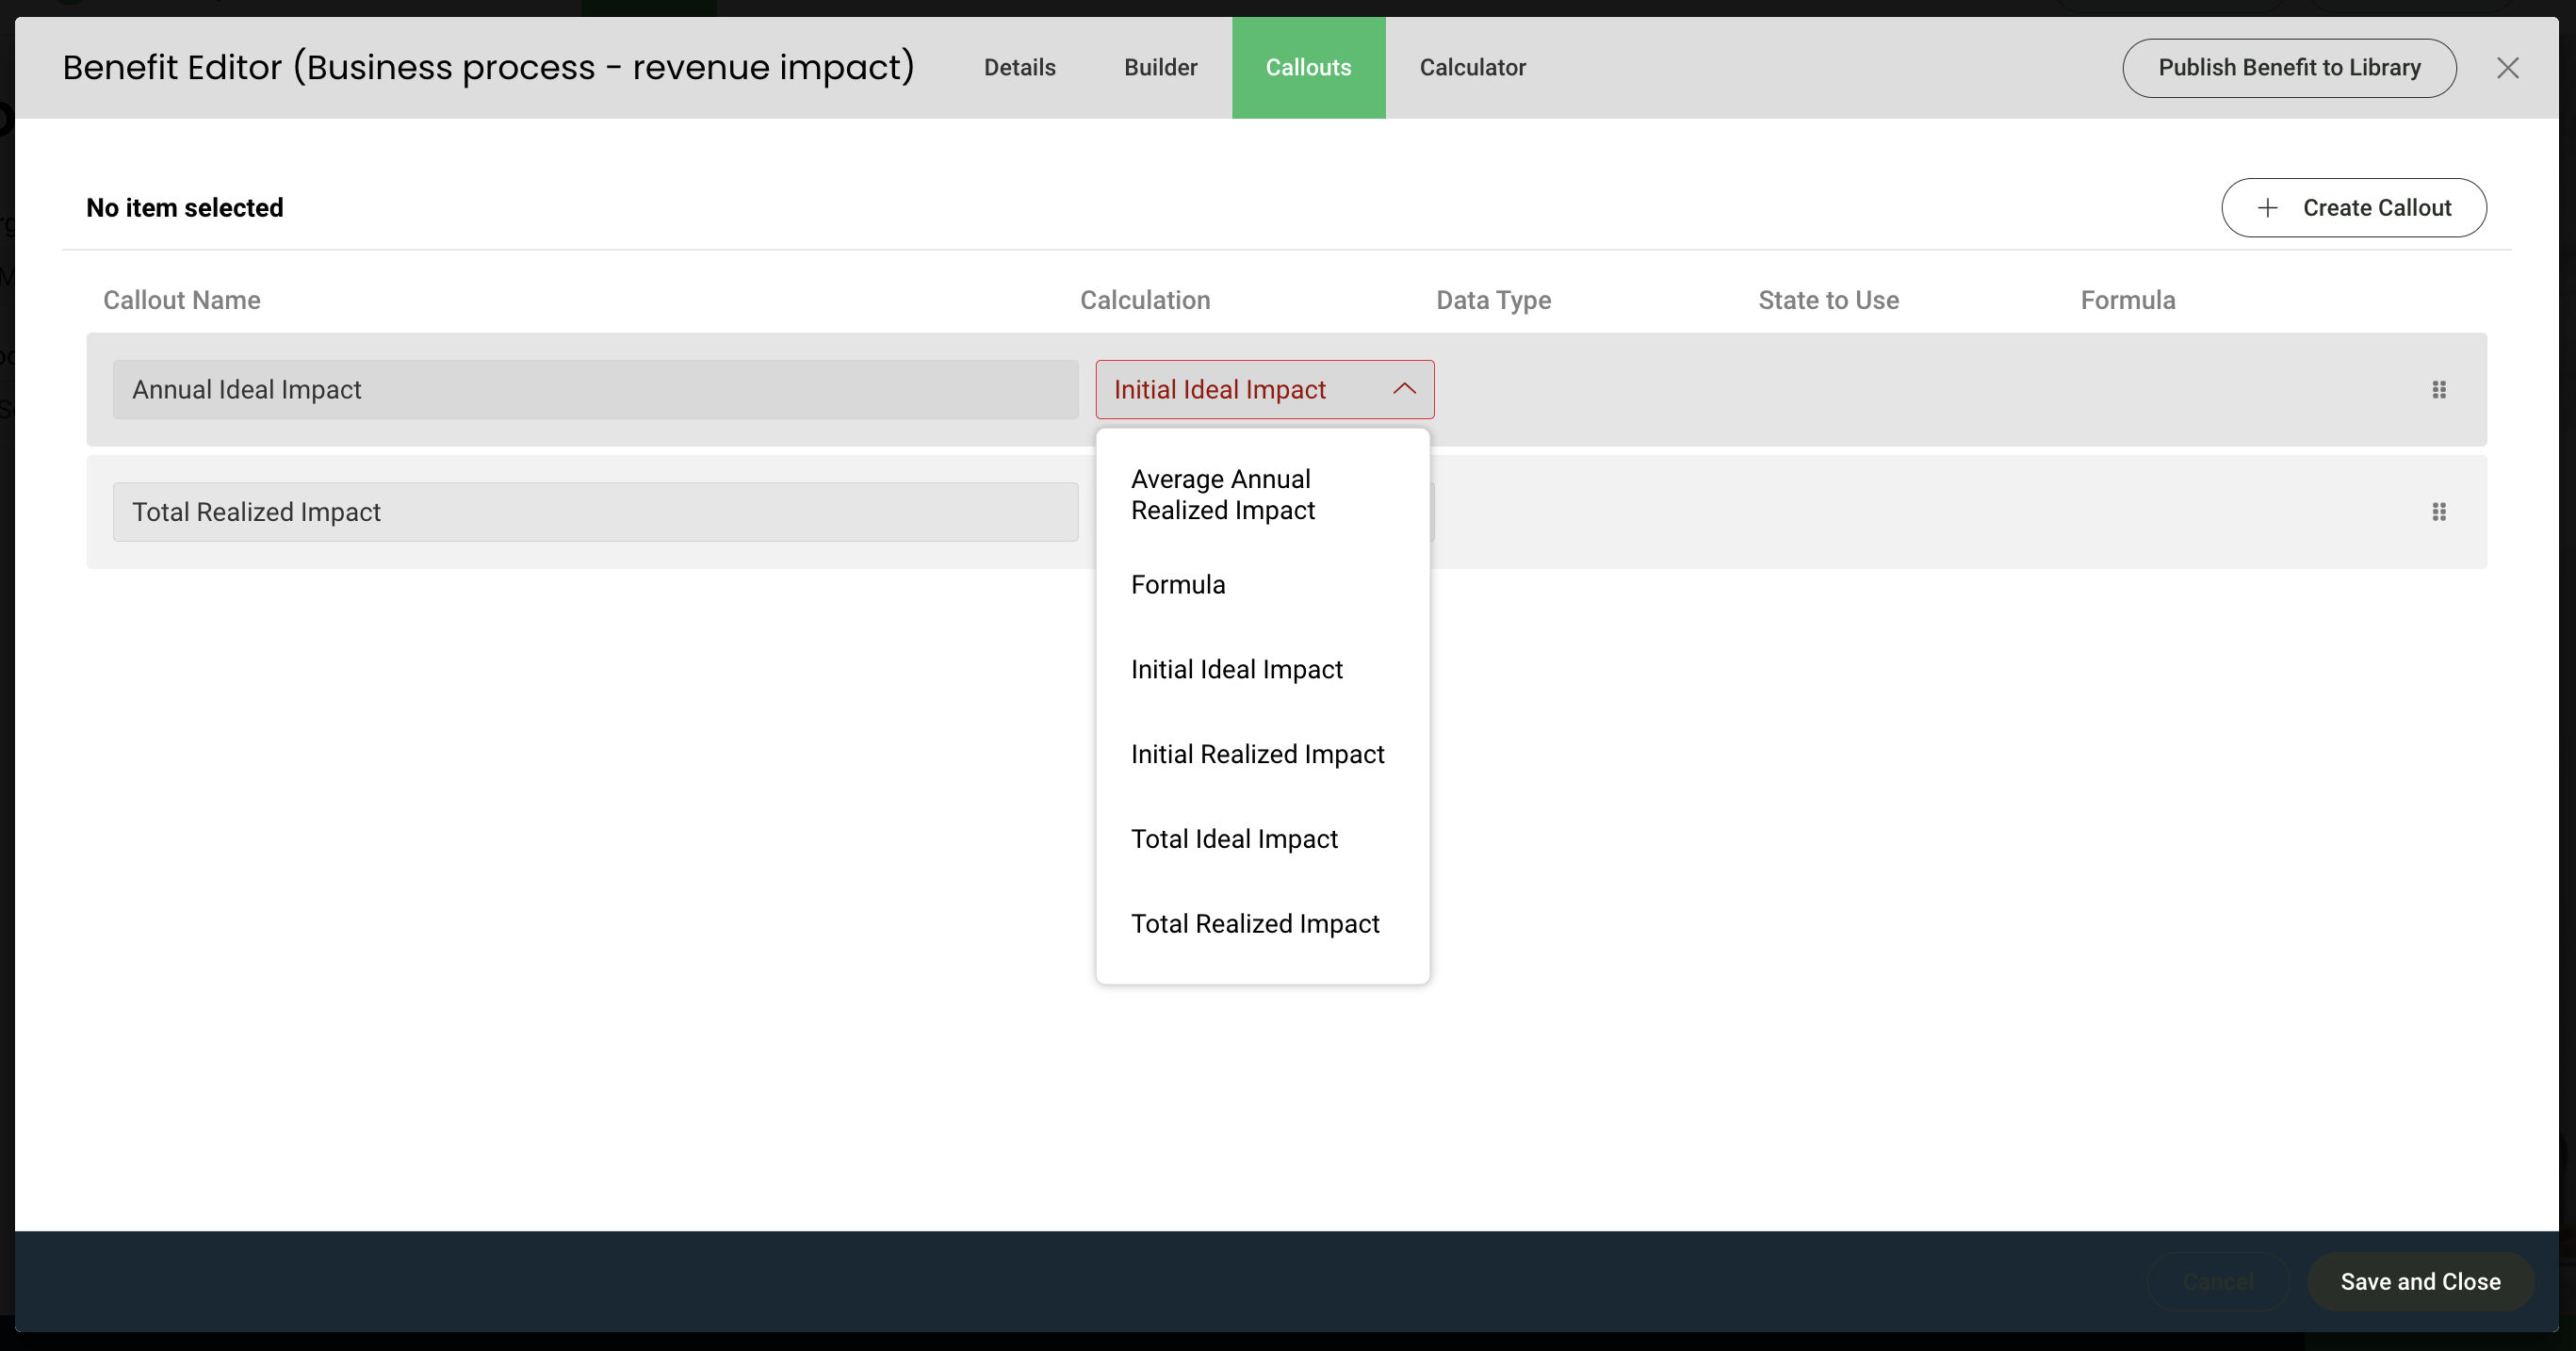
- The calculation dropdown menu provides you with your available options, which can be derived from sub-calculation formulas or default calculations provided in the tool.
- If Formula is chosen, you are able to add in the letters that correspond with the line items to build the custom callout. You also have the option to choose the default state - current, impact, or proposed.
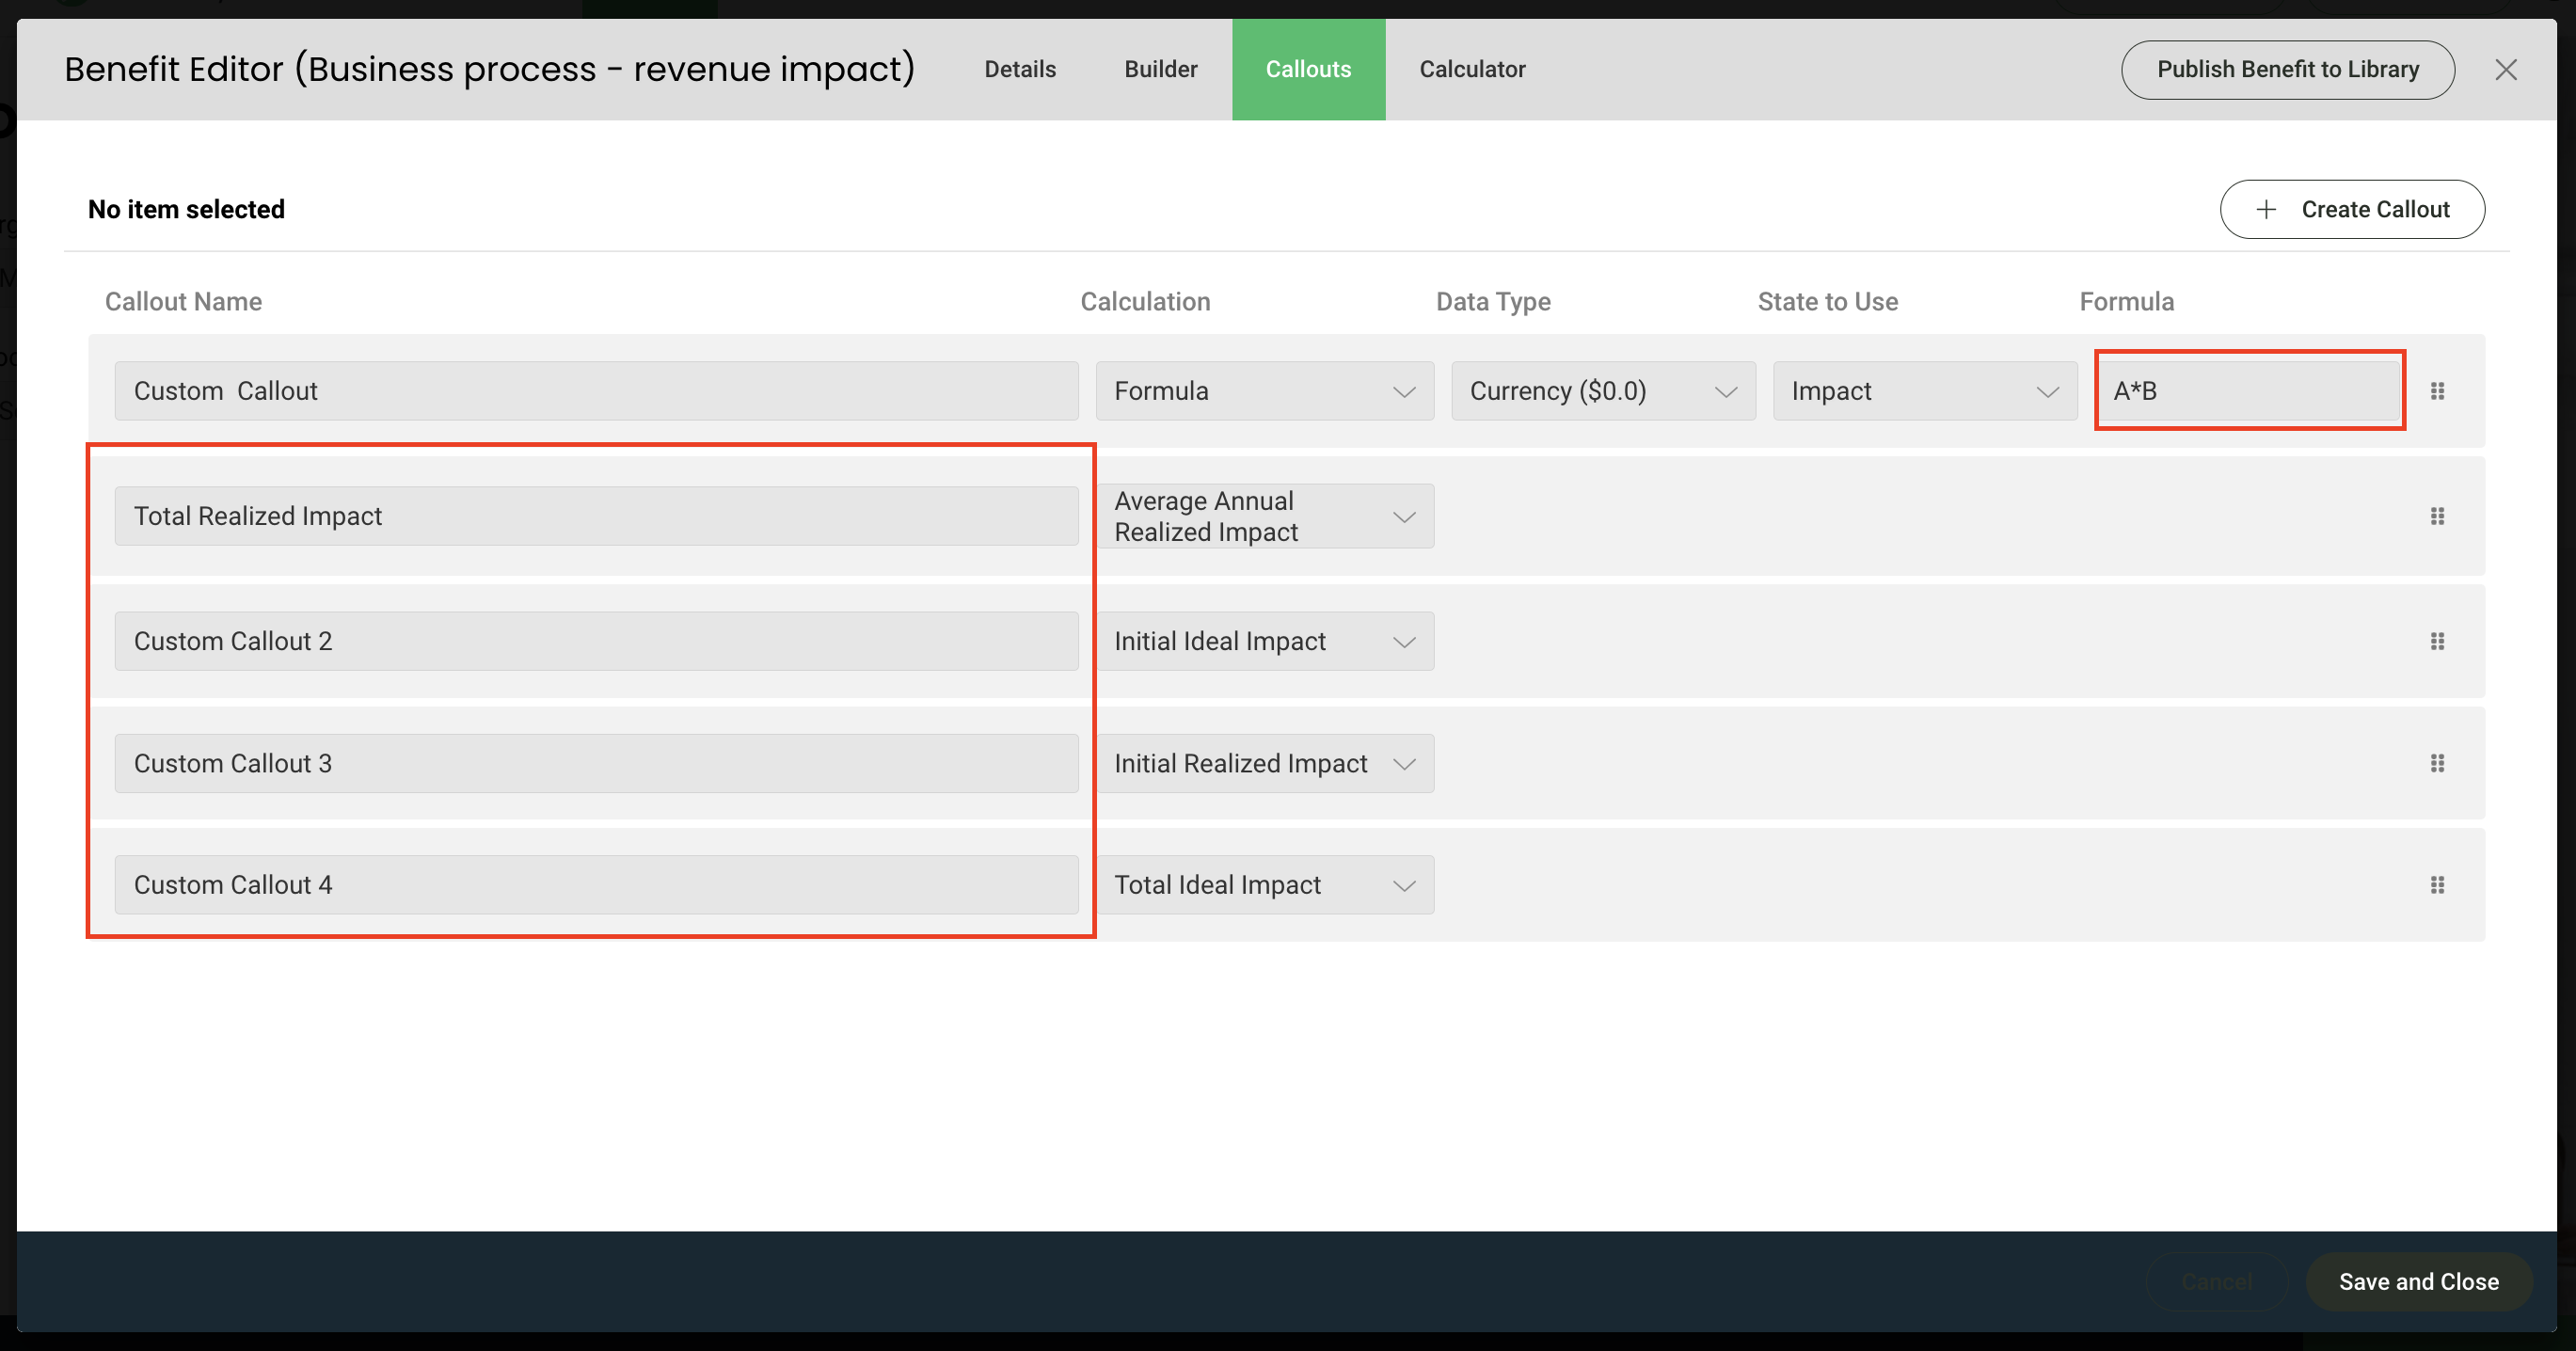
- Once you’ve created and configured your callouts, you will see them displayed on the calculator tab
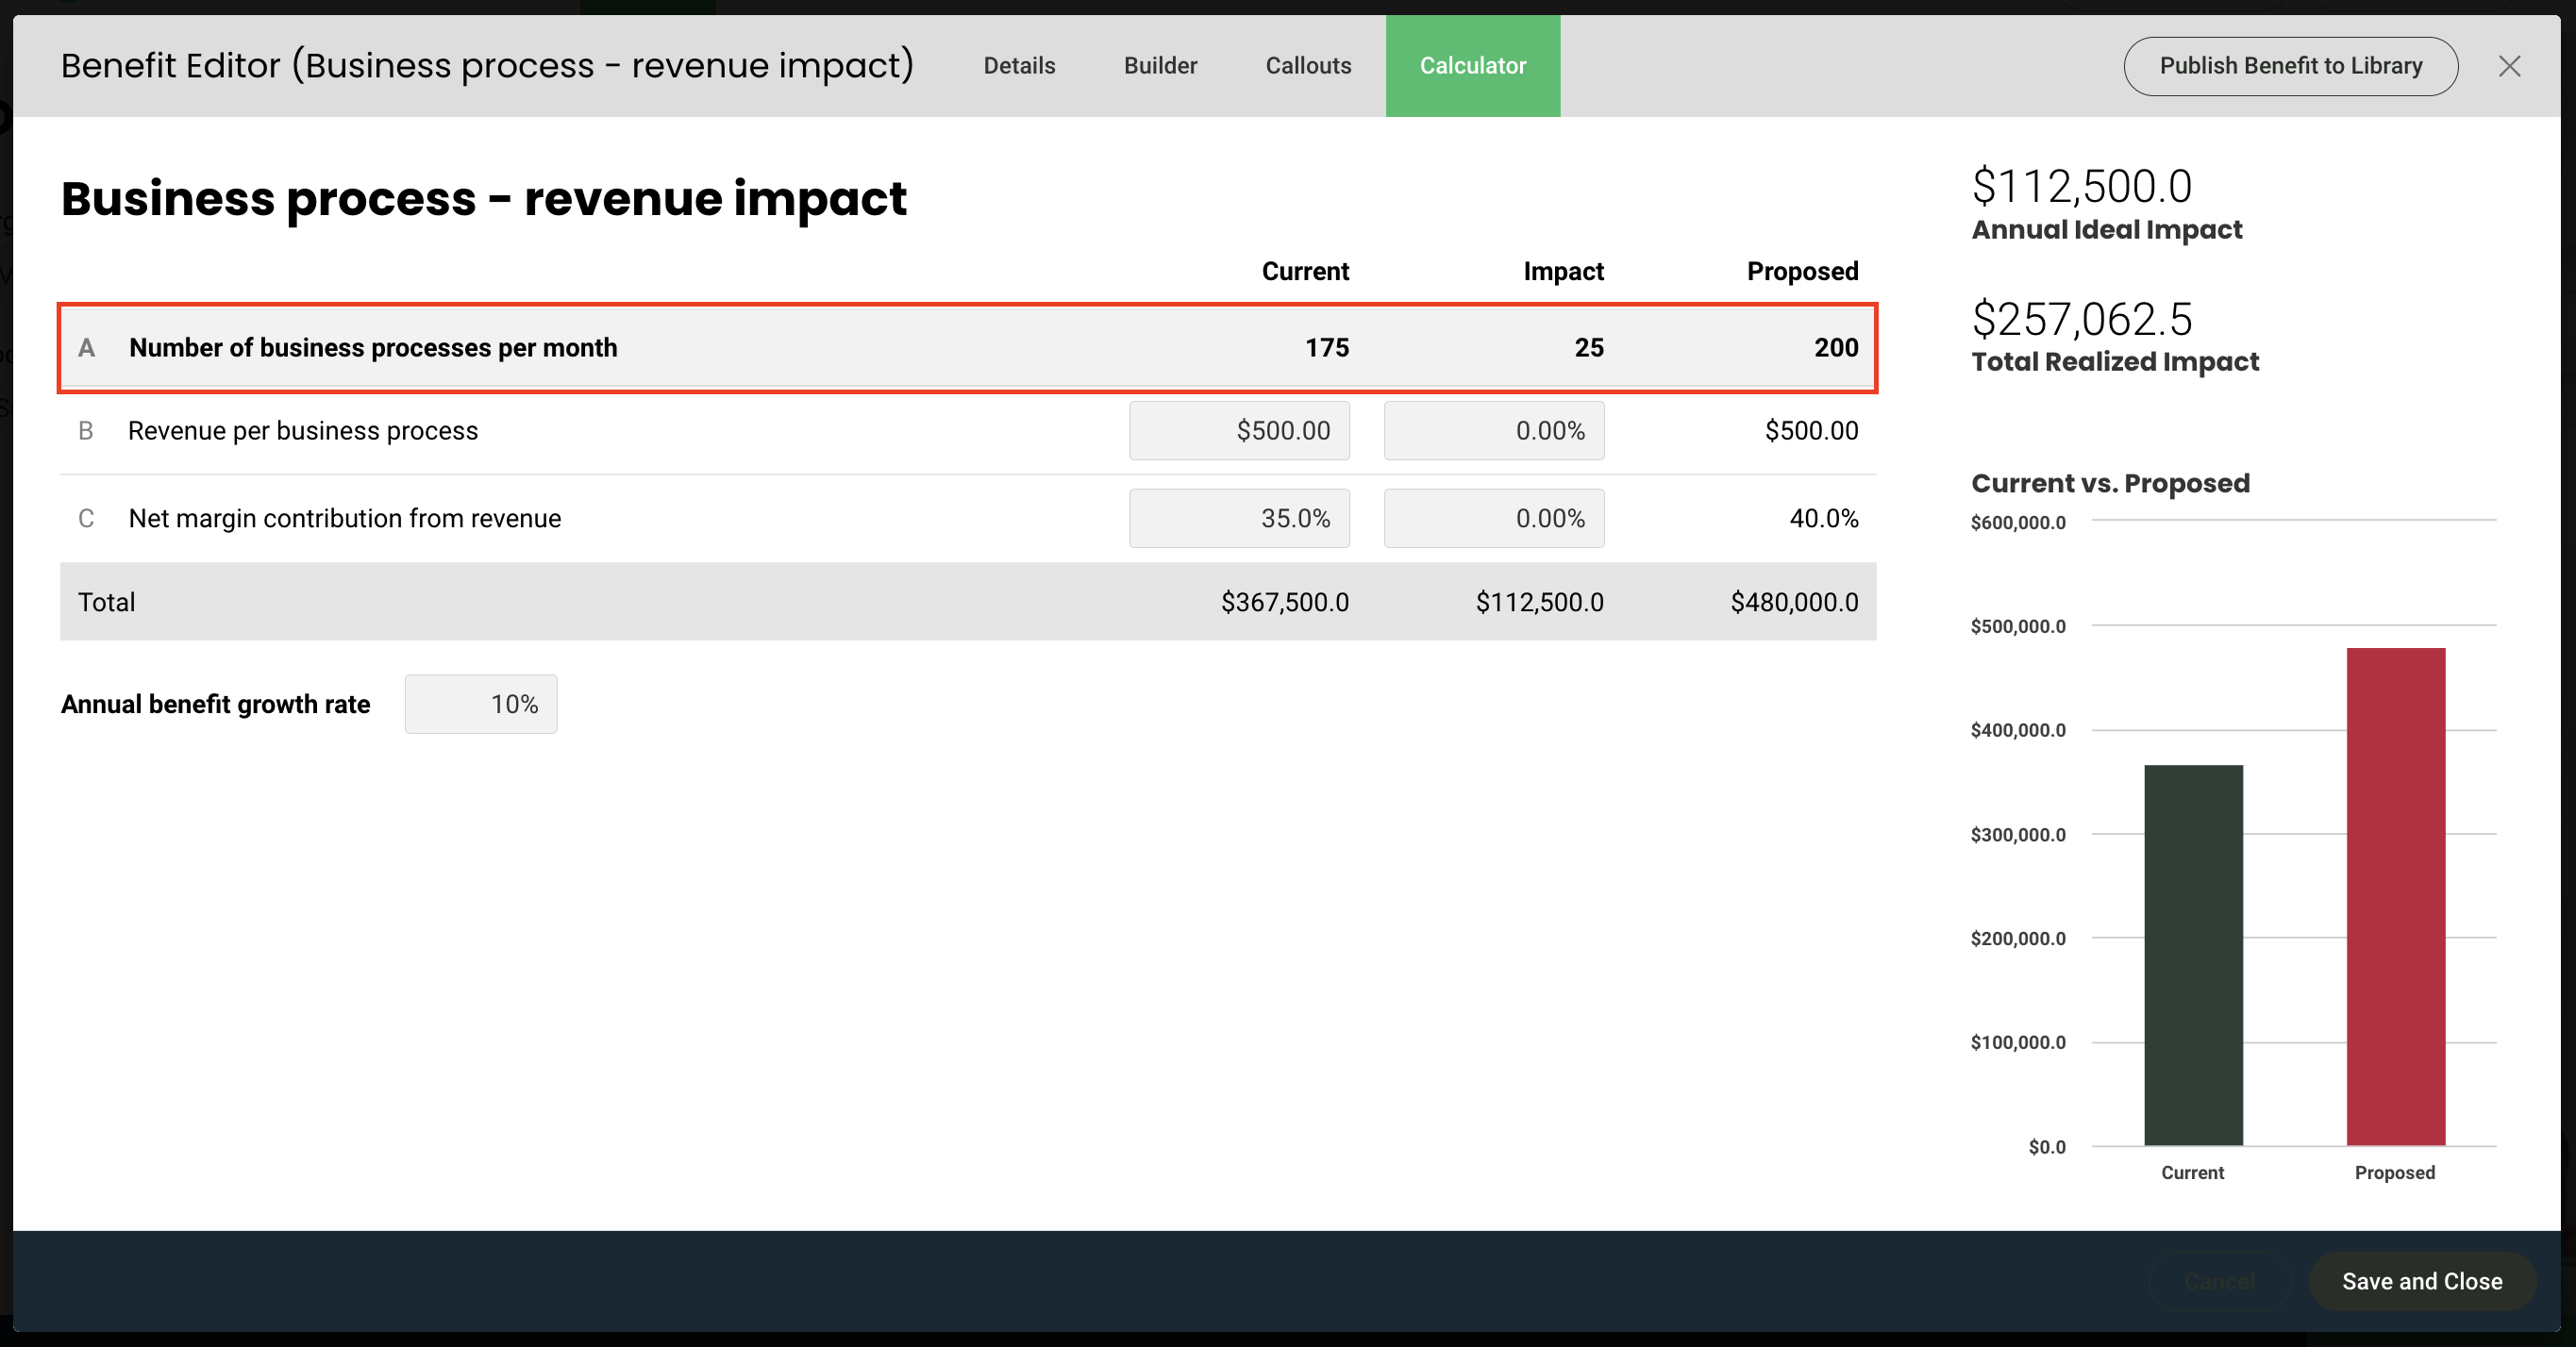
Calculator
The Calculator allows authors to review their calculator and make fine-grained adjustments to comprehensive, year-specific, and scenario-specific realization factors; benefit growth rates; deployment time decisions; and adjust the Installment Method.
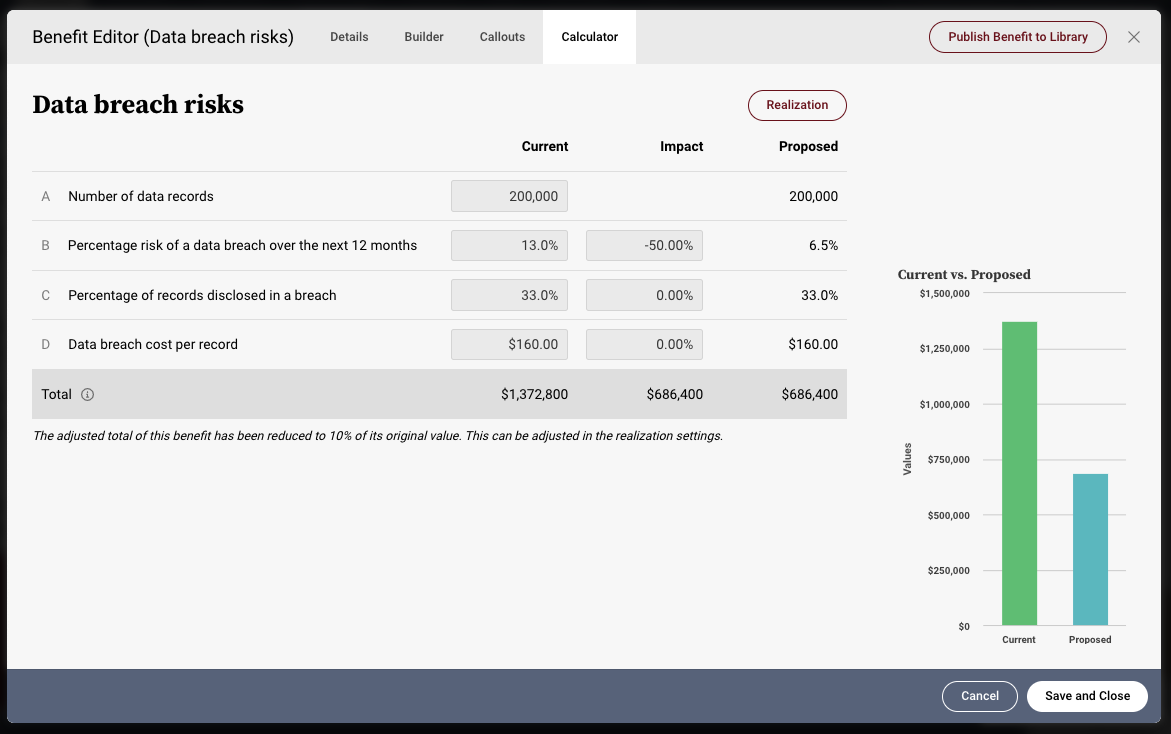
The main section of the Calculator tab lets the author view the calculator from within Value, and lets them make broad changes to it. All values found on this tab are duplicates of values found on the Builder tab, and adjustments made here will be reflected on the previous tab as well. As the author makes changes, they can see the impact to calculations in the right hand sidebar.
From the main Calculator tab, tapping on Realization shows more options:
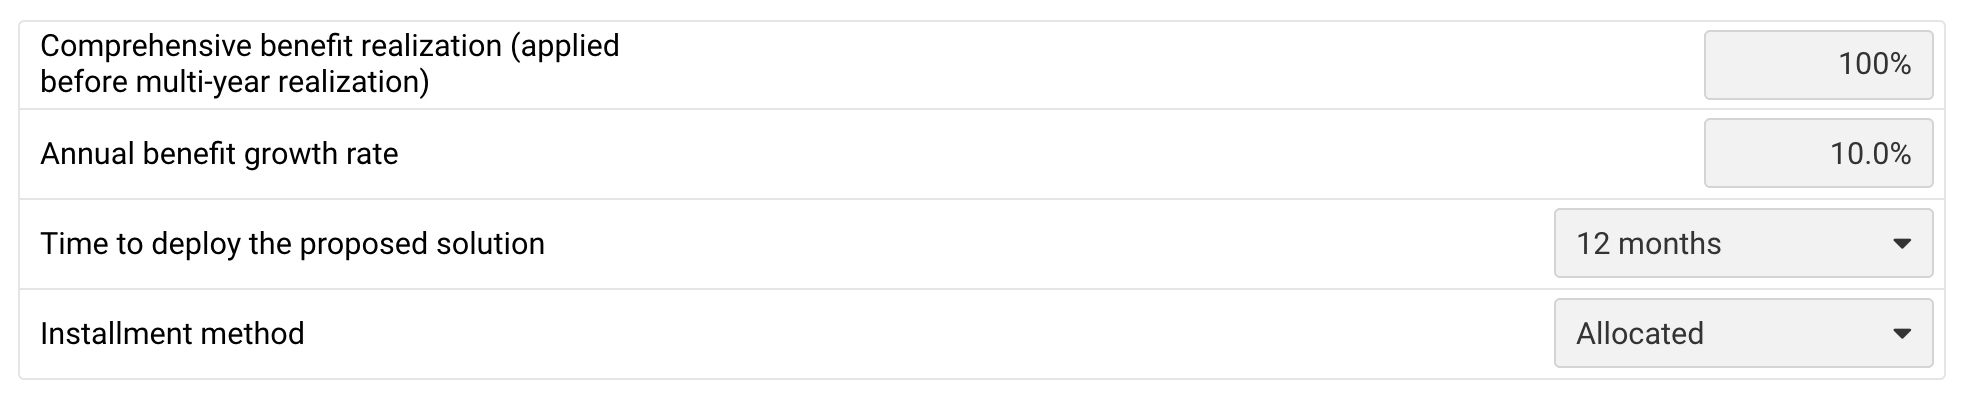
The following options are available:
- Comprehensive benefit realization: adjusts the realization factor for all benefit values by the percentage listed, uniformly
- Annual benefit growth rate: adjusts how quickly the values grow year over year
- Time to deploy the proposed solution: indicates how long it takes to start realizing value. E.g. setting to 12 months will make Year 1 show no benefit
- Installment Method:used to determine the timeframe for the realization of benefits. The options are Annual and Allocated. Annual means that 12 months of benefit will accrue on day 1 of the month in which the benefit is set to realize (taking into effect the Time to deploy the proposed solution choice above). Allocated will break the benefit values down to each month, and incur 1/12th of the annual benefit in each month (also taking into effect the Time to deploy the proposed solution choice above).
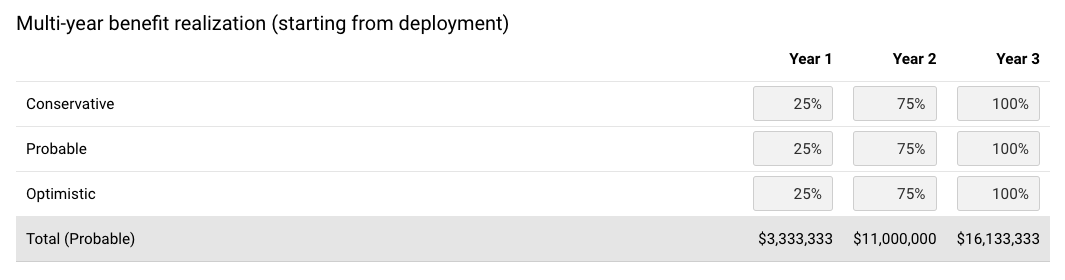
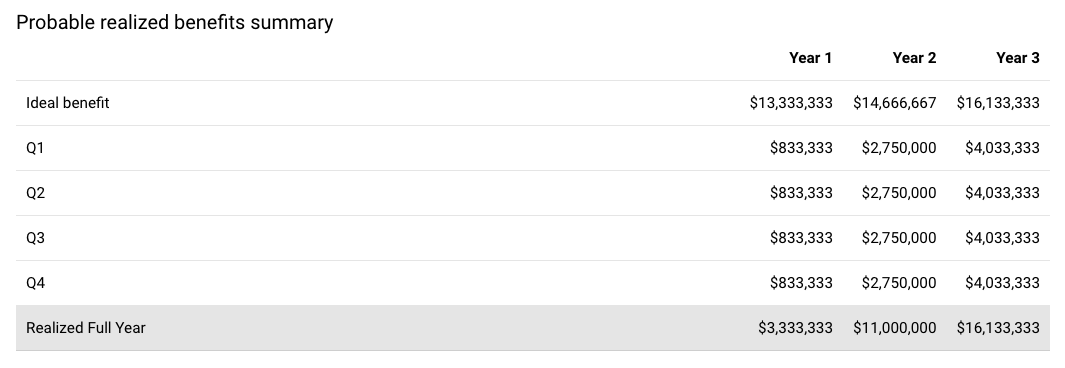
Multi-Year benefit realization (starting from deployment): this section lets the author adjust the realization rate by scenario, by year. This is cumulative with the value of Comprehensive benefit realization above. E.g. if that value is 80%, and this value is 20%, the actual benefit that would be experienced for this year/scenario combination would be 80%*20%, or 16%
If you scroll lower, you will see a detailed Benefit Realization table given the options you've chosen above:
Calculator Row Tooltips
Using the “Edit Details” button available when you select a line item in a benefit, you can add a tooltip to the row, or make the row read-only.
- If read-only is chosen, the row will not be editable by a user on the calculator tab. Your tooltip icon will also be displayed here.
Replies have been locked on this page!