
Intelligence Reports consider data first and visualization second. That means you can establish the data you want to see and then decide which visual(s) represent it best. Historical inflow / outflow can provide insight into historical changes in your data.
Out of the Box Historic Inflow / Outflow Reports
Intelligence provides some historic inflow / outflow reports right out of the box for common use cases.
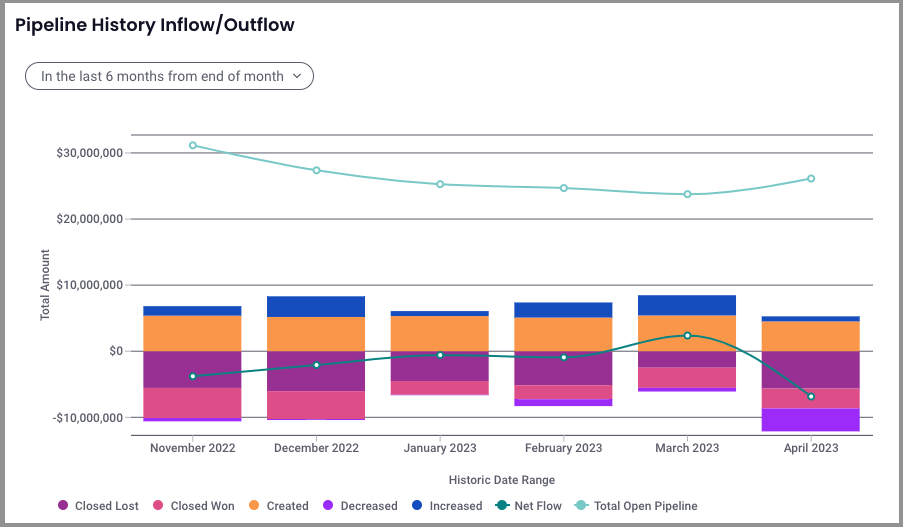
Pipeline History Inflow / Outflow
Inspecting the historical trends of your pipeline can be a vital tool in adjusting your tactics to win more in the future. Pipeline History Inflow / Outflow shows those historical trends, and you can make adjustments to control time period, stage, amount, how the data is split, and much more - giving you the power to look back from countless perspectives to determine where you can improve so you can win. more. deals.
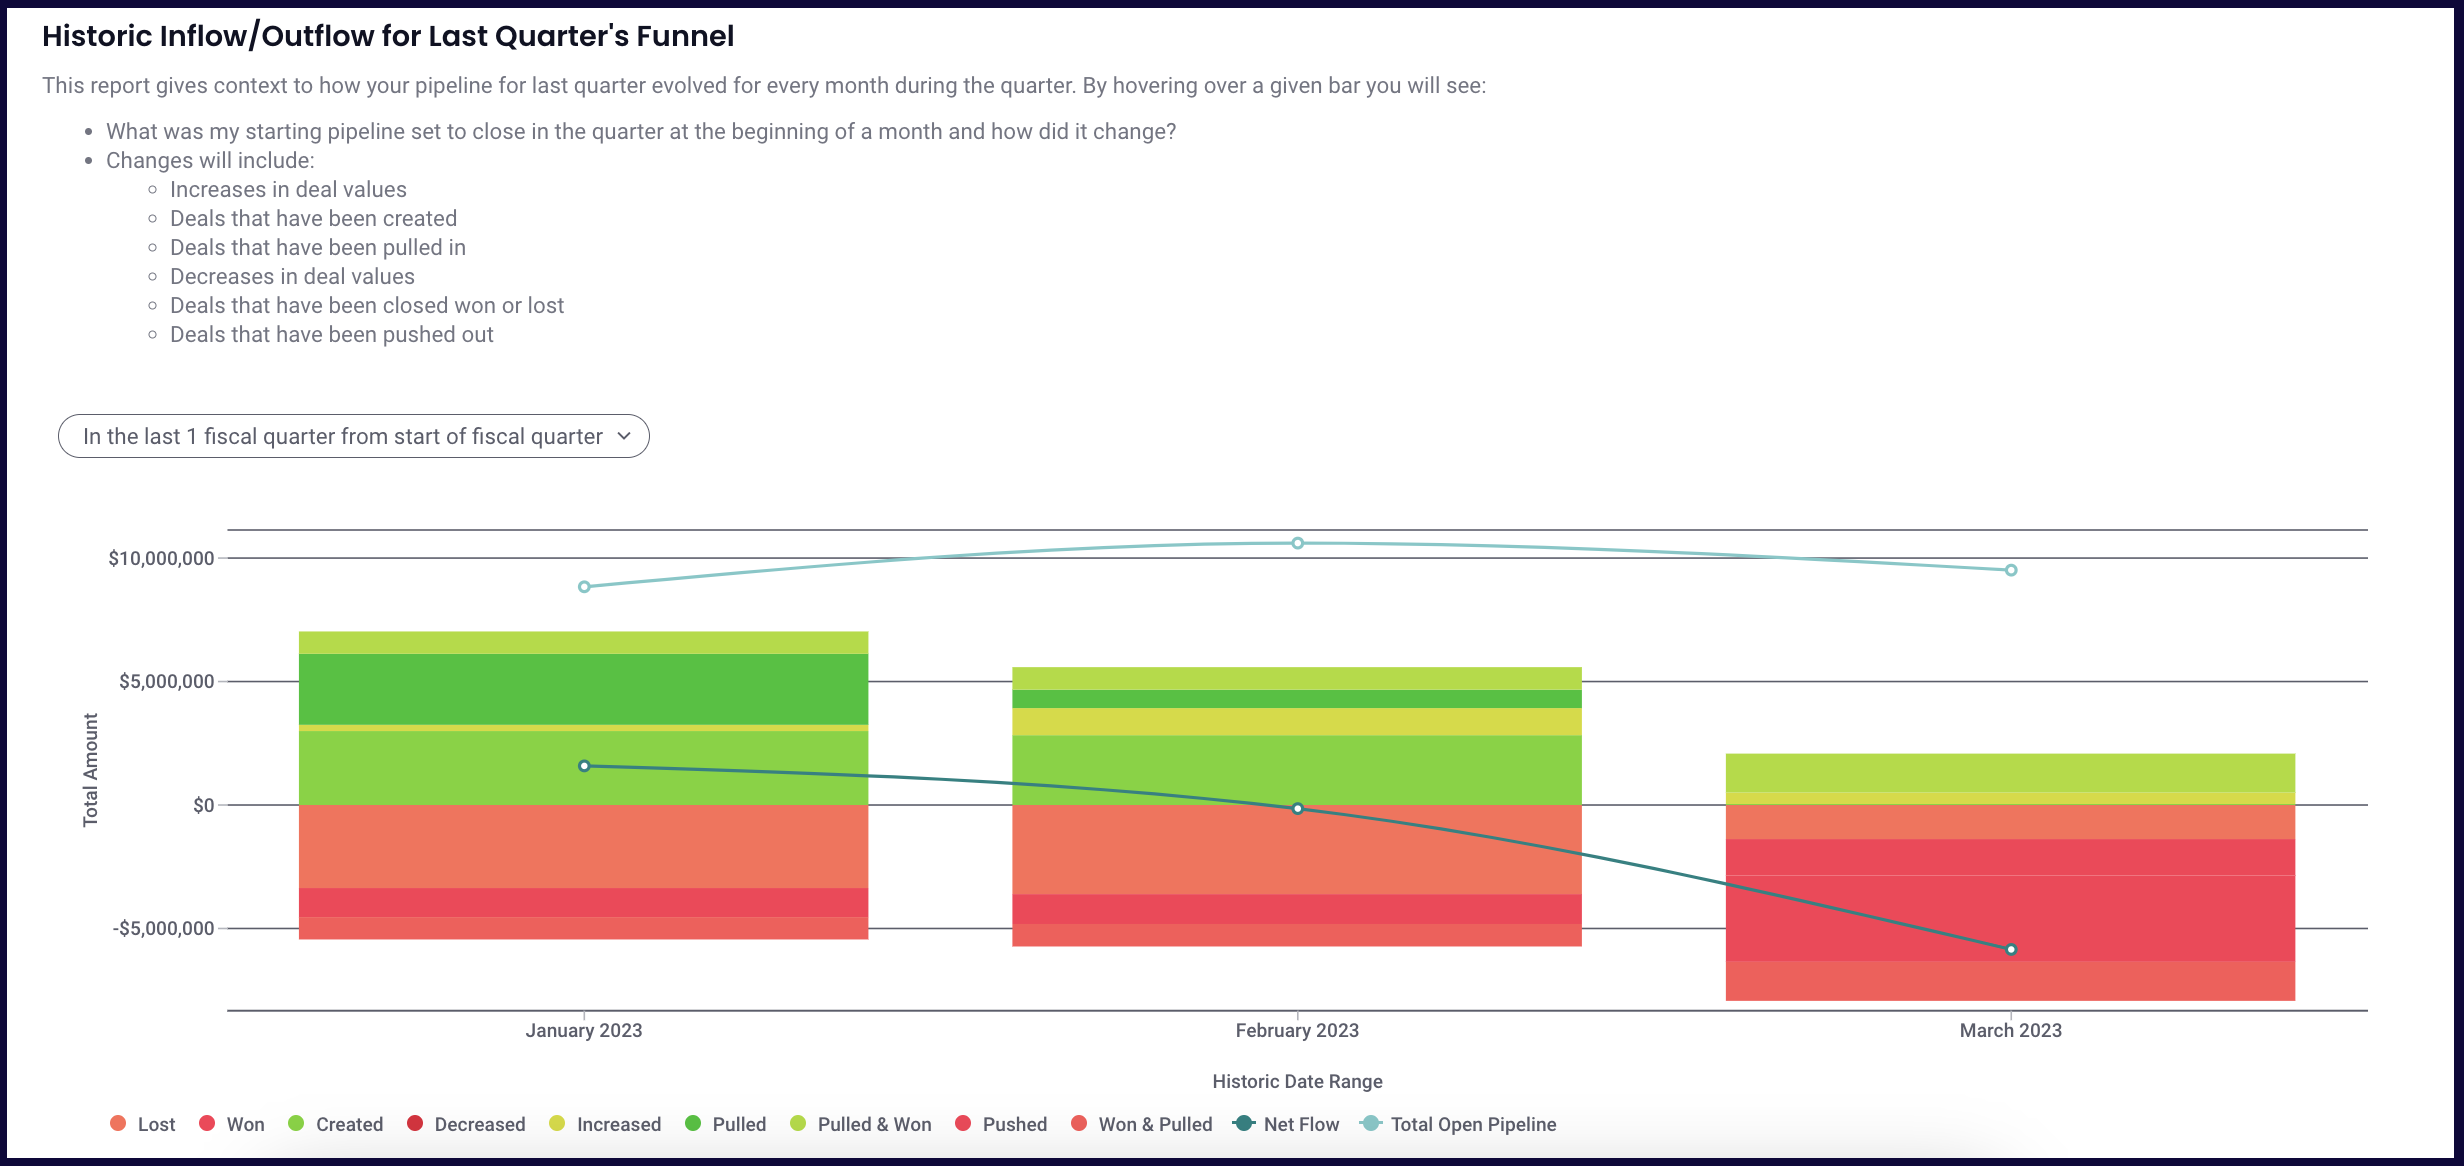
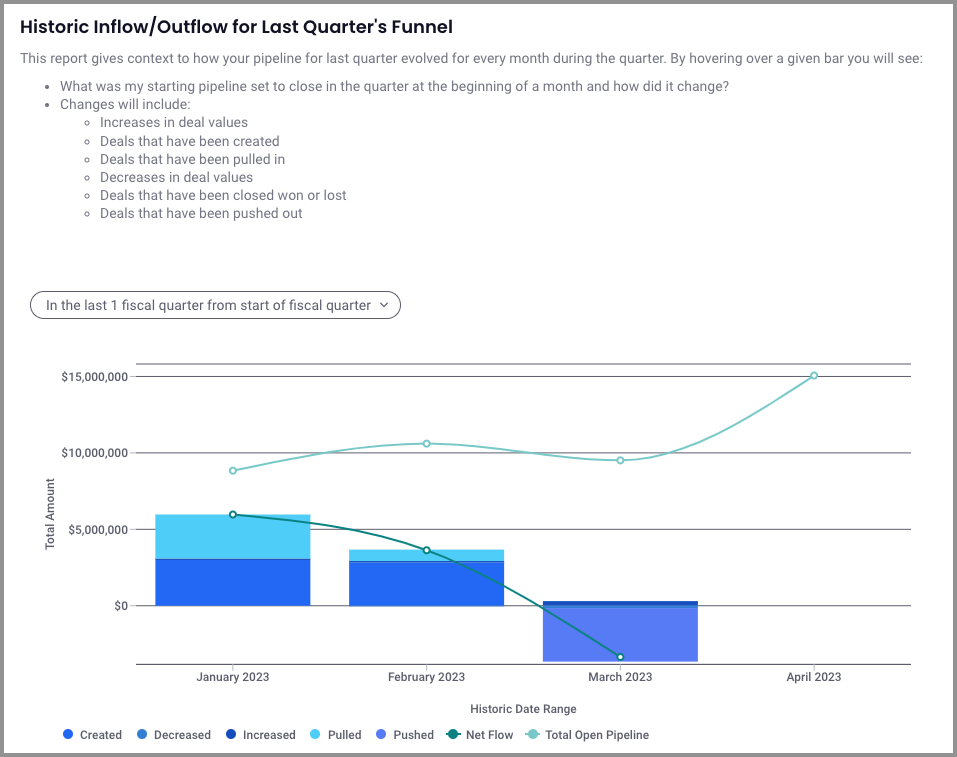
Historic Inflow / Outflow for Last Quarter's Funnel
The Historic Inflow / Outflow for Last Quarter's Funnel gives you context to how your pipeline for last quarter evolved for every month during the quarter. The major difference between this report and the one above: enabling push/pull.
Creating an Historic Inflow / Outflow Report (Configuration)
Since data comes first, start with Creating & Editing Reports, then come back to this article when you get to the filter section to set up the Historic Inflow / Outflow visualization.
Filter (optional)
As with any other report, you can choose which content to display on your report. If a filter has a specification, data will be filtered to match it. Filters filter out data that matches it in its current state. You can also select which properties you want listed as columns in the report grid.
Historic Filter (optional)
Historic filters will filter out data based on the data as it was within the period. You can choose which content to include in historic calculations, adding a historic filter(s) is necessary to show which data is being considered in the "in/out" portion of the visualization configuration below. If no historic filter is selected, the "in/out" section will automatically be set to "off". If multiple historic filters are included, any data returned as "in" or "out" must match ALL included historic filters.
Visualization
Visualization Type
Select Historic Inflow Outflow Chart

Add report summary
As with any report, you can add a custom card summary with hyperlinks and data variables.
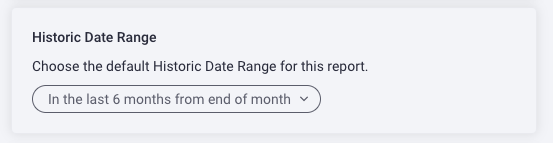
Historic Date Range
The historic date range determines the range for which the chart will display data.
You can adjust the historic date range directly on a dashboard for interactive reporting to show the same data in a different historic date range, but the in-card adjustments will not be saved. The default historic date range selected within the report editor is the default range, if you want the card defaulted to a different range, it must be adjusted and saved here in the report editor.
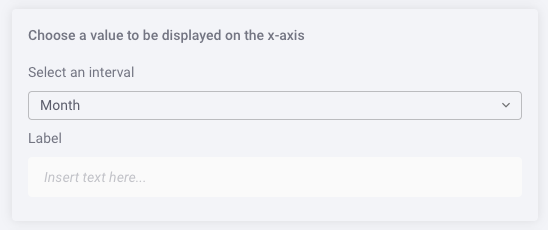
Choose a value to be displayed on the x-axis
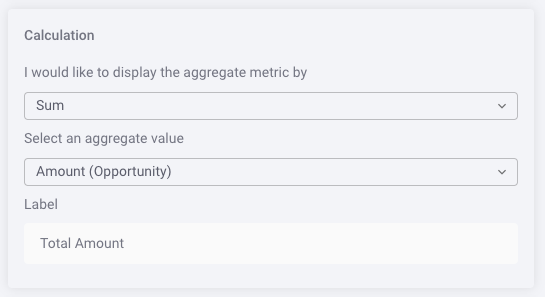
Calculation
Selecting the calculation information determines the math we run to build each bar and is driven by our historical reporting. With multiple options, this kind of flexibility gives you so many possibilities for representing data in an inflow/outflow report.
Select Sum for a sum total or Count for a total count, then select the property you want to calculate. You can add a custom or variable Label.
The Visualization sections below determine which data buckets will be included in the inflow/outflow, each represented by a bar labeled to match the configuration. The flexibility of these options allows you to determine exactly what data is visualized.
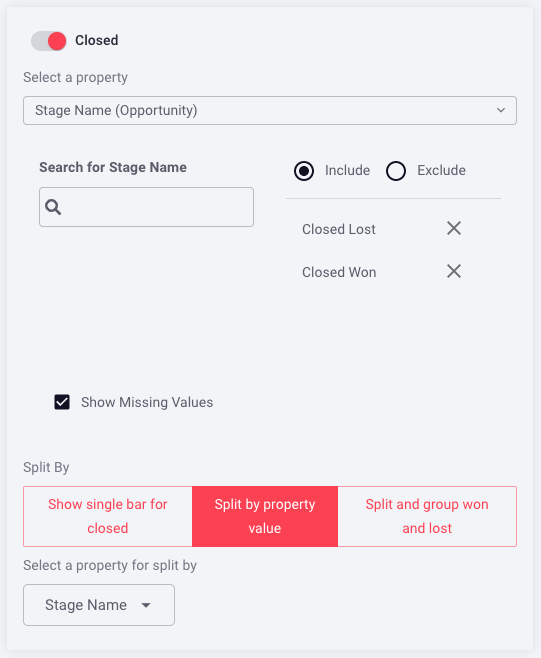
Closed
-
Toggle off/on to determine if you want Closed data to be present (on) or not present (off). If you select "on", complete 2-4, if you select "off" no further options will be presented in this section.
-
Select the Property from the dropdown to apply the Closed consideration, for example, "Opportunity Status".
-
Select property options, with the above example you could choose one or multiple options applied to Opportunity Status, like Lost, Open, or Won. The options presented will be based on which property was selected above.
-
Split By (optional)
-
Show single bar for closed: no splits, one bar will represent anything closed in the period
-
Split by property value: split applicable properties by selecting the matching property from the populated dropdown, eg., Opportunity Status
-
Split and group won and lost: Users can dictate what the definition of what a “win” is (see in the config: “Select which values of this property are “Won”. All other values matching the above Closed filter that do not match this filter are considered “Lost”.) Once this definition is determined, opportunities that were, for example, both created AND won within the selected period will be visible in the waterfall chart. You can see both “Created & Won” and a “Won & Created” buckets in the example chart below, these two buckets balance each other out (+/- the same amount) since both the creation & closing happened within the period, so they are not included in either the beginning or ending amount, the entire thing happened IN PERIOD. When “split and group won and lost” is not selected, no changes that occurred completely within the period will be visible
-
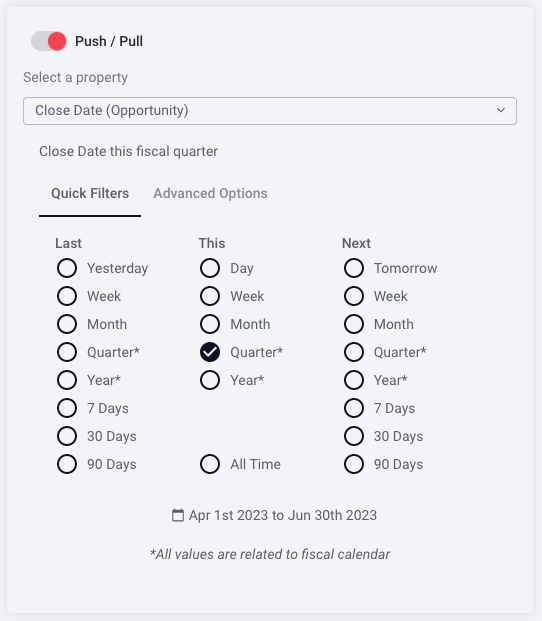
Push / Pull
|
Pro tip: Enabling push / pull will change the way you're viewing the data so it's important to understand what this does and when it fits your needs. When should I leave push / pull OFF?When you want to see how much total pipeline you have & how the data has flowed each month. Example: Pipeline History Inflow / Outflow out of the box report Note:Total Open Pipeline here is representative of total open pipeline for all time, unless a filter is applied. When should I turn push / pull ON?When you want to see how pipeline for a given period has changed over multiple intervals. Example: Historic Inflow/Outflow for Last Quarter's Funnel out of the box report Note: Total Open Pipeline here is representative of total open pipeline for that interval (i.e. Quarter) |
-
Toggle off/on to determine if you want Push/Pull data to be present (on) or not present (off) in the graph. If you select "on", complete 2-3, if you select "off", no further options will be presented in this section.
-
Select the property by which to determine what you base both push and pull.
-
Select property options which will be based on the property selected above.
This configuration would include any opps that were:
-
Pushed: the opportunity {close date} WAS in the flow {this quarter} but now it IS NOT (it used to live inside this range, but has been pushed out of the selected range)
AND/OR
-
Pulled: the opportunity {close date} WAS NOT in the flow {this quarter} but now it IS (it used to live outside of this range, but has been pulled within the selected change range)
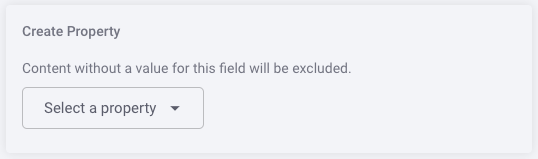
Create Property
You can select a property from the dropdown that will define what your period range is based on, such as Created Date, or the date the opp was created.
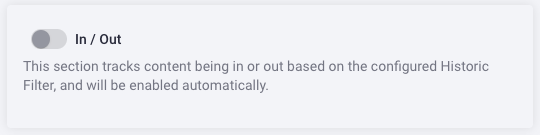
In / Out
This section tracks content being in our out based on the configured Historic Filter and will be enabled automatically IF a Historic Filter(s) is present. If no Historic Filter is selected, this will automatically be toggled "off".
Net Flow
You can elect to overlay a line on the graph that tracks net flow for visibility into net flow over the time period.

Total Open Pipeline
You can elect to overlay a line on the graph to track total open pipeline based on total open pipeline at the beginning of the period.

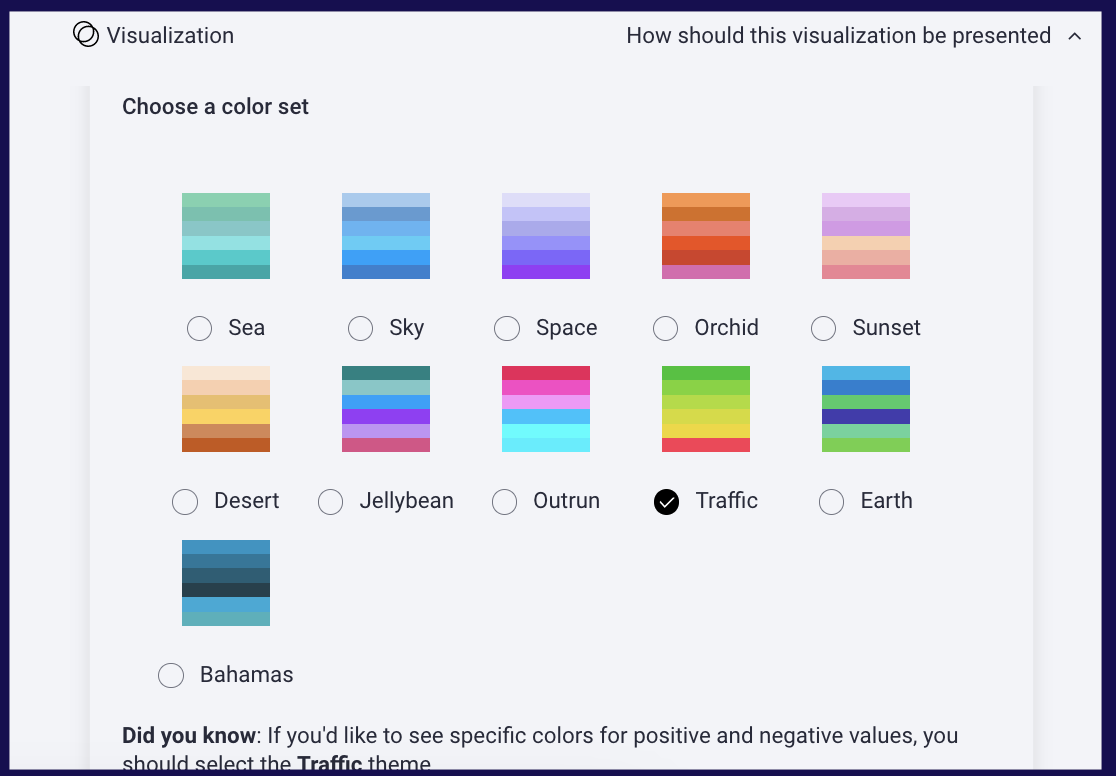
Choose a color set
Select a color scheme.
Pro tip: Using the Traffic theme creates variations of green for positive values and variations of red for negative values to easily visualize inflow vs. outflow at a glance.
When you're happy with your configuration, be sure to click SAVE.
Historic Inflow / Outflow Component Definitions
The definitions below describe what each bar you can see in an inflow/outflow chart means . Keep this list handy while you're learning to read your flow reports so you understand exactly what the information you're looking at means for your business.
Note: Not all bars will be present in all inflow / outflow charts.
-
Starting Pipeline (matches filter)
-
Is open
-
Is in push / pull range
-
Was created before start of interval
-
Matches historical filter
-
-
Created
-
Is open
-
Is in push / pull range
-
Was create after start of interval
-
-
Re-opened (Only visible when Closed is enabled in the configuration)
- Is open
- Is in push / pull range
- Was closed before the start of the interval, and re-opened after start of interval
- Matches historical filter
-
Increased
-
Is open
-
Increased during interval
-
-
Pulled
-
Is open
-
Did not match at start of interval
-
Does match at end of interval
-
-
In
-
Did not match historical filter at start of interval
-
Does match historical filter at end of interval
-
Does match push / pull range
-
Created before start of interval
-
-
Out
-
Did match historical filter at start of interval
-
Does not match historical filter at end of interval
-
Does match push / pull range
-
Created before start of interval
-
-
Decreased
-
Is open
-
Decreased during interval
-
-
Pushed
-
Is open
-
Did match push / pull range at start of interval
-
Does not match push / pull range at end of interval
-
-
Pulled and Won
-
Was not closing in push / pull range
-
Is current won as of end date of range
-
Is currently in push / pull range
-
-
In and Won
-
Was not "in" in push / pull range
-
Is current won as of end date of range
-
Is currently in push / pull range
-
-
Created and Won
-
Was not created at start interval
-
Is created now
-
Is won now
-
Is currently in push / pull range (missing filter)
-
-
Won
-
Is closed
-
Was open at the start of interval
-
Is won at end of interval
-
Was not created and won, was not pulled and won
-
-
Lost
-
Is closed
-
Was open at the start of interval
-
Is lost at end of interval
-
-
Ending Pipeline
-
Is open
-
Is in push / pull range
-
Exists at the end of interval
-
Matches historical filter
-
Replies have been locked on this page!