
The Weekly Commit Dashboard has been created and configured for you right out of the box, so your Execs, Sales Leaders, and Reps have a built-in dashboard based on best practices, utilizing your data.
About the Weekly Commit Call Dashboard
WHAT data is included: Opportunities / Forecast
WHO should us it: Executives, Sales Leadership, Reps
WHEN to use it: Each Monday to kick off the week
WHY use it: Get forecast updates review priorities
Usage by Persona
Use by Persona: This Dashboard supports a weekly gathering of the Sales Team to review if we are on track for our Commit to the business. It is intended that this review is done as a team so that reps understand what is being inspected, come prepared and have their data in CRM updated for this review to move quickly. This dashboard and team meeting is not an in-depth opportunity review (that is done 1st week of each the month). This meeting is focused on change, risk to the forecast, next steps and help needed to execute.
Dashboard Focus:
- Progress of opportunities in the forecast
- Identify Risk
- Discuss action plans
Note: Sort all cards by value (Largest Top)
The Weekly Commit Call Dashboard
The following rows and cards make up the template of reports we consider best practice for a Weekly Commit Call Dashboard. Each card can be opened with one click to further inspect data with a more focused view on a particular report.
We recommend having your Weekly Commit Call Dashboard dashboard open in another window as you walk through what's included.
Row 1
Review how CRM Pipeline “Commit” and “Upside” has changed over the last 7 days for the current quarter.
- What Business questions are we answering?
- How is our open pipeline commit and upside changing?
- Are we bringing in as much as we see moving out?
- Visibility to ask the reps why opps are moving out
- Should we have identified risk earlier?
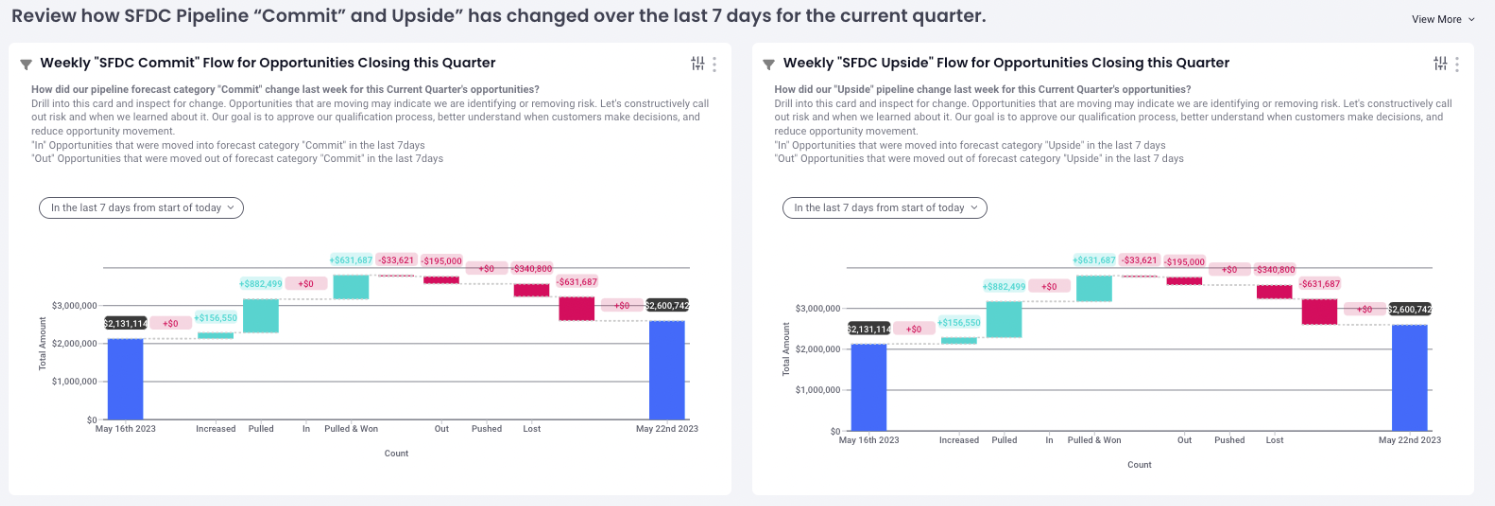
Weekly "CRM Commit" Flow for Opportunities Closing this Quarter
Focused on the how CRM Commit Pipeline has changed over the last 7 days
Weekly "CRM Upside" Flow for Opportunities Closing this Quarter
Focused on how CRM Commit Pipeline has changed over the last 7 days
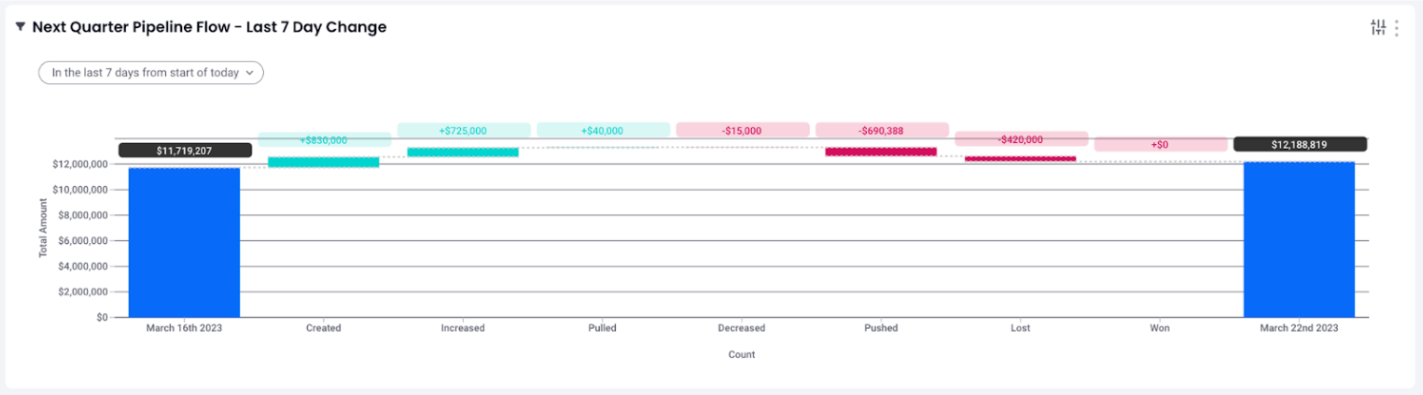
How do we use this report: What you're going to see at the start of the weekly Commit Call is what we call Pipeline Flow Report, which is a change report. We always start every weekly commit with what changed over the last seven days since our last weekly commit team call. We review the change period shown by the start date with pipeline value (blue bar on right) and end date with pipeline value (blue bar on right). We can see the additions, opp movement, and changes that basically underpin or bridge the pipeline during the change period being reviewed.
This is a good way to understand how disciplined we are relative to the quality of the funnel 7 days ago by looking at the additions, moves, and changes, and we can click on any one of these columns, to get the underlying data.
For example, we can look at the deals that were created, increased, or pulled in by clickin on the corresponding bar. This is a great opportunity to call out our reps success to the team. Conversely, by clicking in and reviewing what was pushed from this period, we can work with the rep to understand what happened and what we can do in the future to identify risk earlier to avoid negative changes to the pipeline. We use this report to manage to change and use constructive criticism when we miss qualifications that could have prevented change that now puts pressure on the team to replace.
Reps ask, are you getting better at delivering a higher quality funnel by keeping a focus on what's changing and what should I have known at the beginning of the month to be able to represent my funnel more accurately this period?
Row 2 (SFDC Version)
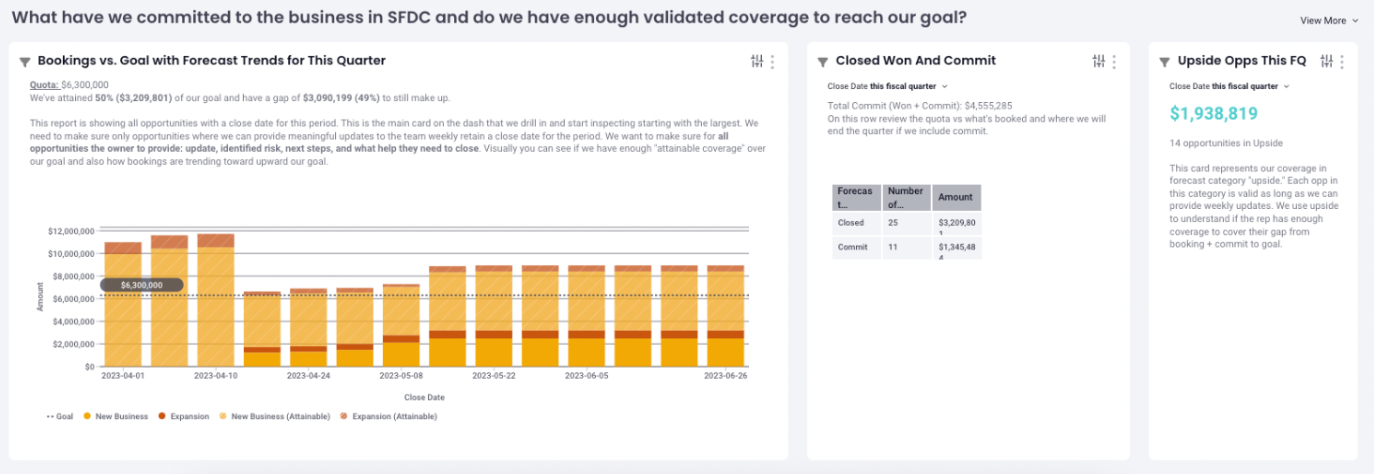
What have we committed to the business and do we have enough validated coverage to reach our goal?
What business questions are we answering?
- Are we on pace with our goal?
- What is my bookings + commit in CRM?
- What upside do we have as coverage?
- How has our pipeline changed over the period (if on week 1 our Monthly Forecast 1:1 Review was done well, we should not experience a significant drop in coverage as we execute highly qualified opps through the period)?
- Managers with multiple segments can easily see forecast call to goal per segment
How do we use these three cards together: Look at the data points here relative to where we are toward our goal. On this row review the goal vs what's booked and where we will end the quarter if we include commit. Consider the gap between bookings & commit total and our goal, then review the quality of the upside opportunities to determine if we have enough to reach our goal.
CQ Bookings vs Goal & Coverage (Bar Chart)
- This Report Visualizes: Attainment by week, coverage by week (attainable), goal, and weekly forecast trend
- Coverage (attainable): The stripped section of the bars (Can be defined in goal settings ex. Open pipeline: Qualified is >=stage 2)
- Bookings to Date: Solid portion of bar (not visible here) represents bookings
- Grey Dotted Line: represents the goal for the period
- Hovering over report columns: Provides week-over-week analysis of bookings, goal & coverage
This card shows all open pipeline and best practice is to review all open pipeline for the period on the weekly commit call. This ensures we review all opps represented with a close date for the period. To be predictive and to have an accurate review of coverage we push out or close any opportunities that we can no longer win in the period. Reps and managers at the beginning of each month on the Forecast 1:1 review need to agree to the opps that will remain with close date for the period. They together agree that these are the opportunities that will be represented to leadership and will then require meaningful weekly updates to defend their place in the forecast.
Why do we do this? We need to understand that our coverage is valid and meaningful weekly updates assure these opps are progressing and have a strategy to close this period. It’s all too common that teams will use a forecast process to pull out the deals they will track and leave a lot of noise in the pipeline for the quarter. These are opps that are not monitored and many teams will then at the end of the period push to the next period. This behavior hurts the current period predictability because leaders see the coverage value and can falsely assume they are in a better position. It hurts next quarter because managers may not be coaching and or monitoring these opps for progressions and next period. What needs to happen is to have discipline around your close date and when an org can make a decision. We will discuss next quarter's review on our Monthly Pipeline 1:1 Review cadence.
Example: If the sales cycle is 200-days then we need to manage close dates so that a rep is not creating opps this quarter when they won't have time to mature them to close. That creates false positives in the system that disrupt our ability to be predictive. This is a common occurrence that SMS will solve when you review all opps with a close date this period starting with the largest during the weekly commit using the current week in CQ Bookings vs Goal & Coverage (Bar Chart) report.
Tip: You can monitor the overtime relationship between the open funnel and bookings. Inspect if the funnel is dropping rapidly which presents risk to hitting our goal. Question if the coverage we started the period with was realistic. Are we doing a good job cleaning our pipeline and managing accurate close dates entering the period?
Tip: Drill into each card an inspect each opportunity starting with the largest values.
Closed Won and Commit:
This card gives us an assembly of what we have booked and what we have in the Forecast Category “Commit.” Commit are opportunities that we expect will close. We can review both values individually but also the total. Its the total that provides us with a view of we feel confident in closing for the period. Some leaders consider this a worst case or conservative number because we have additional deals in “Upside” that we can close in addition to the “Bookings + Commit” number.
Upside:
This card is a group of mutually exclusive opportunities in addition to “Closed Won and Commit” above we have a close date for the period. Upside opportunities have remaining steps required to gain more confidence to close in the period. As mentioned prior we expect the rep to provide weekly progress and updates so that we know these opps still have a strategy to close this period. While a rep may not close all the opps in their upside all of these opps are valid for the period and represent coverage to help the rep close the gap between bookings and commit and their goal. The manager will use the experience to determine if the rep has enough upside to meet their goal. When we learn about risk that these opps will no longer close in the period we move them out.
Note: Teams that are in the habit of reviewing Forecast Category commit then upside then pipeline. Will often spend the most time talking about the Committed deals they know the most about during this very critical call. We recommend instead reviewing all opp with a close date for the period starting with the largest. If that opportunity is weak in the knees and lacks a strategy or meaningful update, its these larger swing deals that need the most coaching and attention to be predictable.
Row 2 Intelligence Forecast Submission Version
What have we committed to the business in our forecast submission process (FS) and do we have enough validated coverage to reach our goal?
What Business questions are we answering?
- Are we on pace with our goal?
- What is my forecast call in I360?
- What upside do we have as coverage?
- How has our forecast and pipeline changed over the period?
- Managers with multiple segments can easily see Forecast call to goal per segment
Look at the data points here relative to where we are toward our goal. When you see “FS” that's the output of ops selected in forecasting submission in Intelligence.
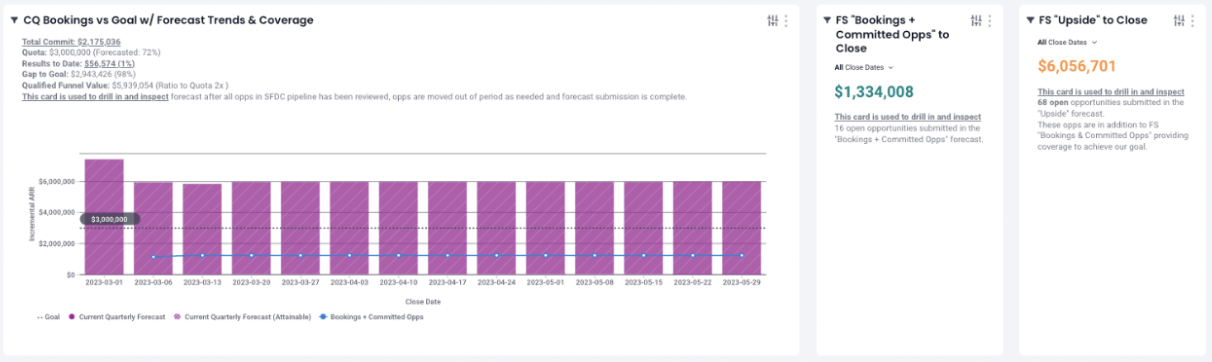
CQ Bookings vs Goal w/ Forecast Trends & Coverage (Bar Chart)
- This Report Visualizes: Attainment by week, coverage by week (attainable), goal, and weekly forecast trend
- Coverage (attainable): The stripped section of the bars (Can be defined in goal settings ex. Open pipeline: Qualified is >=stage 2)
- Bookings to Date: Solid portion of bar (not visible here) represents bookings
- Grey Dotted Line: represents the goal for the period
- Blue Line: Forecast value as saved in I360 Forecast Submission (week over week)
- Hovering over report columns: Provides week-over-week analysis of bookings, goal, coverage and our forecast.
This card shows all open pipeline and best practice is to review all open pipeline for the period. This ensures we review all opps represented with a close date for the period. We can inspect to see if the opportunity is forecasted in I360 Forecast Submission or not and also spot less mature opps by forecast category and or stage that need our attention. Push out or close any opportunities that we can no longer win in the period.
Tip: You can monitor the overtime relationship between the open funnel and bookings. Inspect if the funnel is dropping rapidly which presents risk to hitting our goal. Question if the coverage we started the period with was realistic. Are we doing a good job cleaning our pipeline and managing accurate close dates entering the period?
Tip: Drill into each card an inspect each opportunity starting with the largest values.
FS CQ “Commit” Open Opps
Open this card to inspect opps selected Committed in our Forecast Submission
Have we identified any risk that would prevent this opp from closing?
FS CQ “Upside” Open Opps
Open this card to inspect opps selected in Upside in our Forecast Submission
We need to understand what risk or next steps are required to get our upside into our commit.
Row 3
What needs to be executed this week: Opps closing, meeting agendas & scheduling
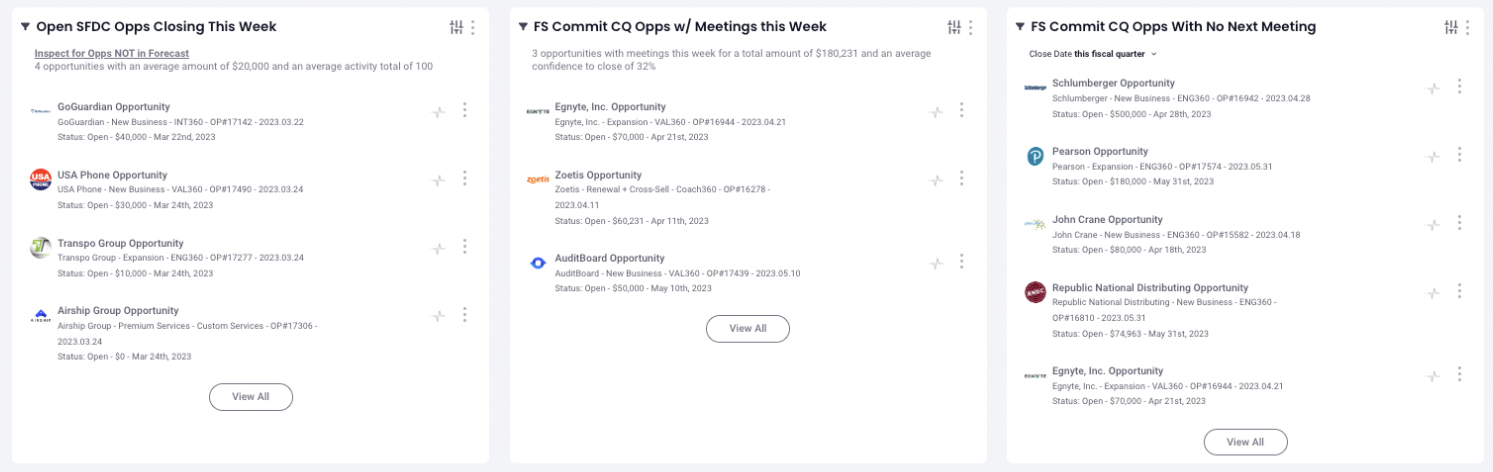
Open Opps Closing This Week: Verify that all the opps the business isexpecting are on track to close this week. When was the last meeting - what was the action coming out of the meeting? Do we have a meeting scheduled and what will we need to accomplish to close? Does the rep need any assistance or any information we may be missing?
Current Quarter Commit Opps w/ Meetings this Week: Discuss agendas on key upcoming meetings for our commits and provide any coaching/strategy from manager or peers that can improve our outcomes
Current Quarter w/ No Next Meeting Scheduled: From an execution standpoint, let's make sure we exit meetings with the next meeting scheduled. Not having a next meeting on our most important opportunities opens the door to risk and or may indicate a stalled opportunity. Use this card to identify and coach on keeping meetings and agendas on track to close for the period.
Row 4
How have the last 7 days affected our next quarter?
If time permits, keep an eye on our efforts that are affecting the next quarter.
If you run into any issues, please contact support.
Replies have been locked on this page!