
The Exec Weekly Dashboard has been created and configured for you right out of the box, so your Execs and Sales Leaders have a built-in dashboard based on best practices, utilizing your data.
About the Exec Weekly Dashboard
What data is included? Opportunities, Accounts
Who should use it? Executives and Sales Leadership
When to use it? Once a week
Why use it?
-
Provides a data-driven framework for reviewing key metrics for the business and whatever is a current focus area.
-
Ensures that Leadership has visibility to what’s required to close the period strong
-
Visualizes the health of the business to help execs track their progress
Usage by Persona
For Executives
When: Weekly
How: During an executive weekly review, cover this dashboard for progression towards milestones and key metrics. Weekly progression, red flags, or strategic initiatives should also be added.
For Sales Leaders
When: Weekly
How: Use this dashboard to prepare for your exec weekly review.
Pre-req Training
Copying and Editing Cards
You may decide you want additional cards similar to what's provided, check out this article on copying and editing cards to learn how you can copy and adjust a current card instead of starting from scratch!
Placeholders
This dashboard contains some placeholder cards, click here to learn how to replace these cards with your own data.
The Exec Weekly Dashboard
The following rows and cards make up the template of reports we consider best practice for an Exec Weekly Dashboard. Each card can be opened with one click to further inspect data with a more focused view on a particular report.
We recommend having your Exec Weekly dashboard open in another window as you walk through what's included.
Row 1: What have we booked recently?
-
Closed Won this Month (Headline)
-
Closed Won Last Month (Headline)
-
Closed Won this Quarter (Headline)
-
Closed Won Last Quarter (Headline)
Row 2: What have we booked recently, by type? How much Pipeline is left?
-
Closed Won this Quarter by Type (Bar Chart)
-
Open Pipeline Closing this Quarter by Type (Bar Chart)
Rows 3 & 4: How are our opportunities changing?
Row 3
-
Progression (Trailing Week) (Placeholder)
Row 4
-
Pipeline Flow Last Week For Opportunities Closing This Quarter (Waterfall)
Row 5: What’s happening in my pipeline this week?
-
Last Week’s Lost Opportunities (Top Content)
-
Open Opportunities Closing This Week (Top Content)
-
Opportunities Pushed in the Last 10 Days (Top Content)
Row 6: What can I expect to close this quarter? Is that enough?
-
Predicted Current Quarter Forecast (Bar Chart)
-
High Confidence Best Case This Quarter (Top Content)
Row 7: What opportunities are at risk? How can I offset that risk?
-
Commit At-Risk this Quarter (Top Content)
-
Potential Pull-Ins (Top Content)
-
Stalled Opportunities This Quarter (Top Content)
Row 8: How have my pipe generation trends changed in the last 6 months?
-
Pipeline Creation Trend by Lead Source (Bar Chart)
-
Pipeline Creation Trend by Industry (Bar Chart)
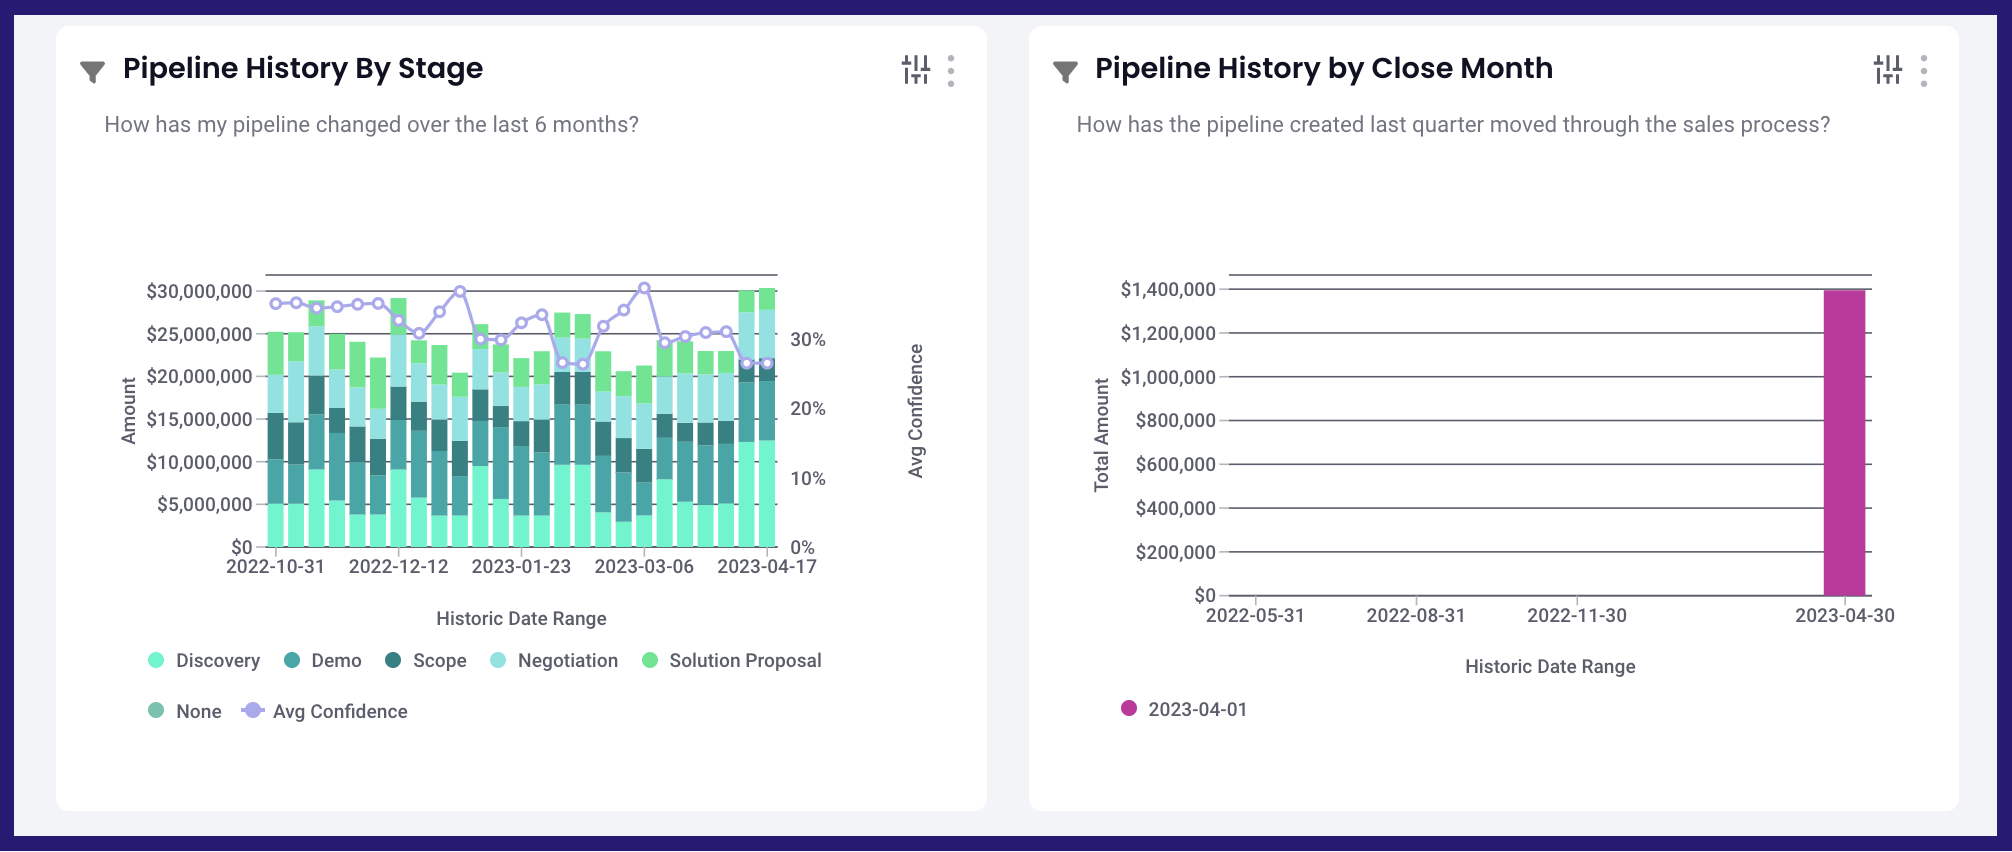
Row 9: How has my pipeline been trending over the last 6 months?
-
Pipeline History by Stage (Historic Bar Chart)
-
Pipeline History by Close Month (Historic Bar Chart)
How did we build this dashboard template for you?
The Executive Weekly Dashboard has been created for you out of the box using the configurations listed below. We love being able to provide this Dashboard out of the box and ready to use, but it's always good to know what data you're working with when you hit the ground running.
Dashboard Configuration
-
Base Template - Generic Opportunity Board
-
Content-Types - Opportunity, Opportunity Split, Opportunity Product, Recording, Recording Topics
-
Filters - Opportunity fields, Account fields, Hierarchy
Filters on Report Drills
Clicking on a card will produce an inspection report so you can drill down on a card's specific data. Each report comes with our recommended best practice filter sets (report columns) that can be customized to best fit your process. Read Interactive Filters to learn more!
Replies have been locked on this page!