
The Engagement Analytics Dashboard has been created and configured for you right out of the box, so your team has a built-in dashboard based on best practices, utilizing your data.
The following rows and cards make up the template of reports we consider best practice for a Engagement Analytics Dashboard. Each card can be opened with one click to further inspect data with a more focused view on a particular report.
We recommend having your Engagement Analytics Dashboard open in another window as you walk through what's included.
Be sure to check out our Content Engagement Analytics Dashboard for more insight into the adoption, engagement, and effectiveness of content across your organization. Here you can learn how regularly reviewing and acting on these insights can enhance user adoption and engagement, and overall content strategy.
Row 1
-
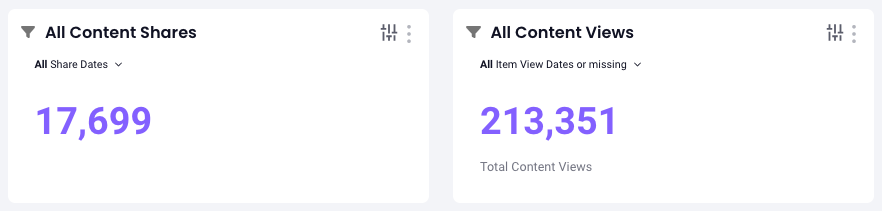
All Content Shares (Headline)
- All Content Views (Headline)
Row 2
-
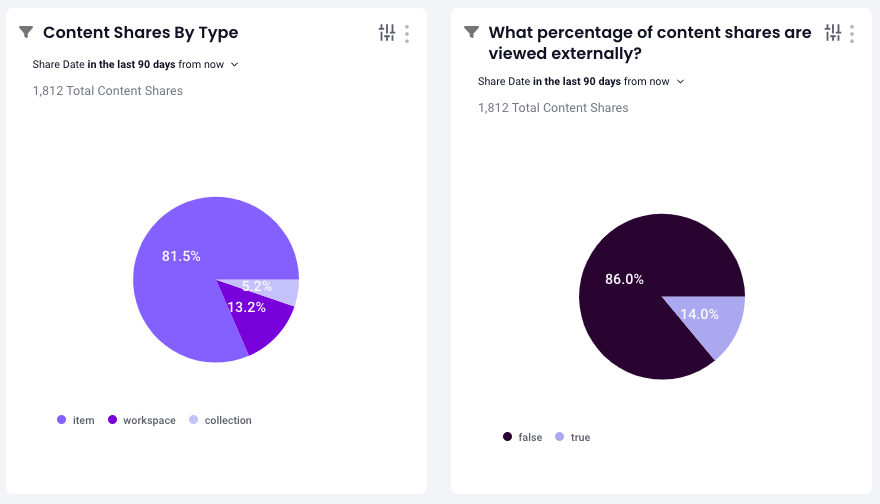
Content Shares by Type (Pie Chart)
- What percentage of content shares are viewed externally? (Pie Chart)
Row 3
-
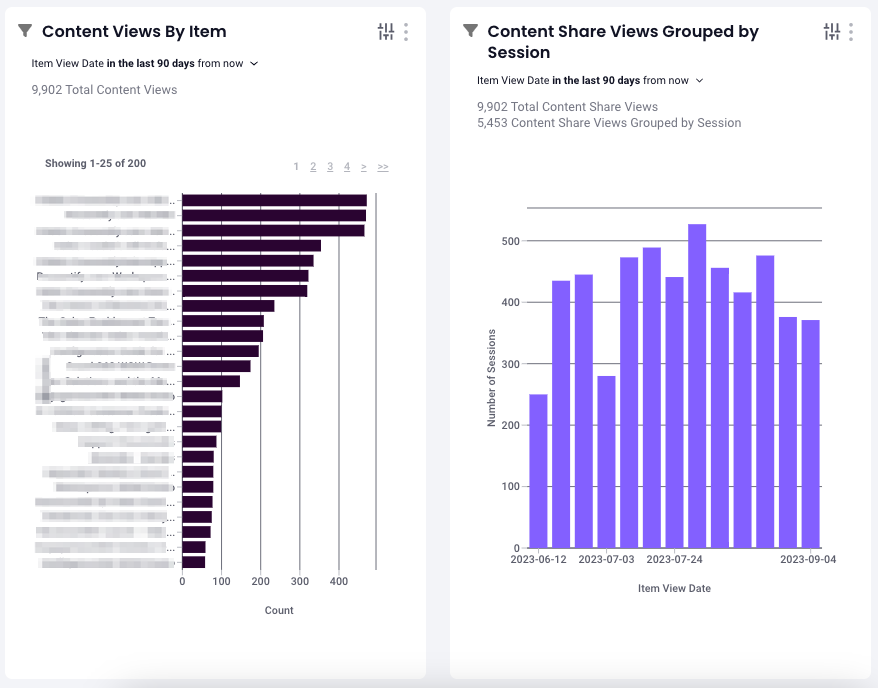
Content Views by Item (Bar Chart)
- Content Share Views Grouped by Session (Bar Chart)
Row 4
-
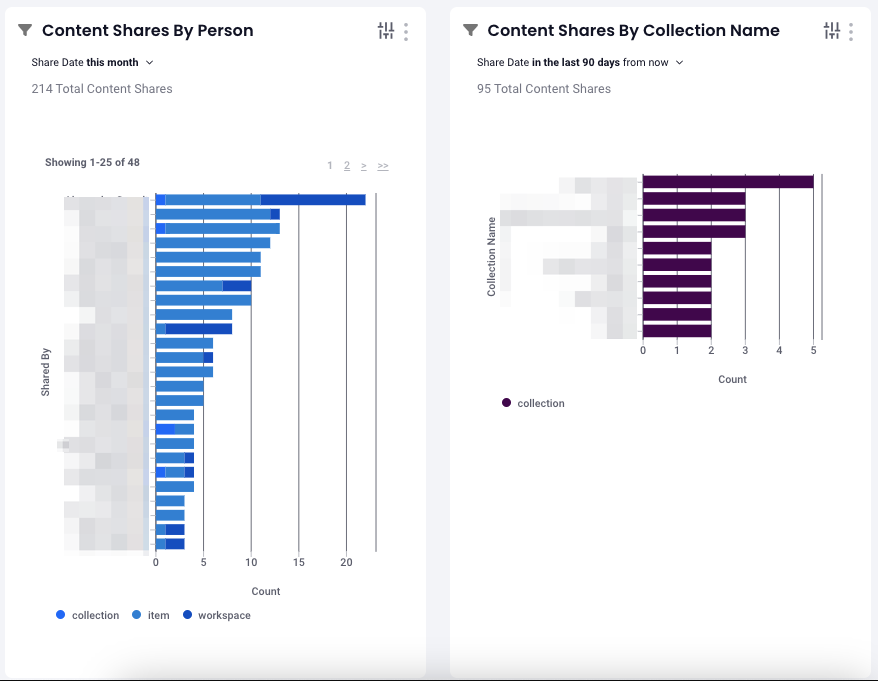
Content Shares by Person (Bar Chart)
- Content Shares by Collection Name (Bar Chart)
Row 5
-
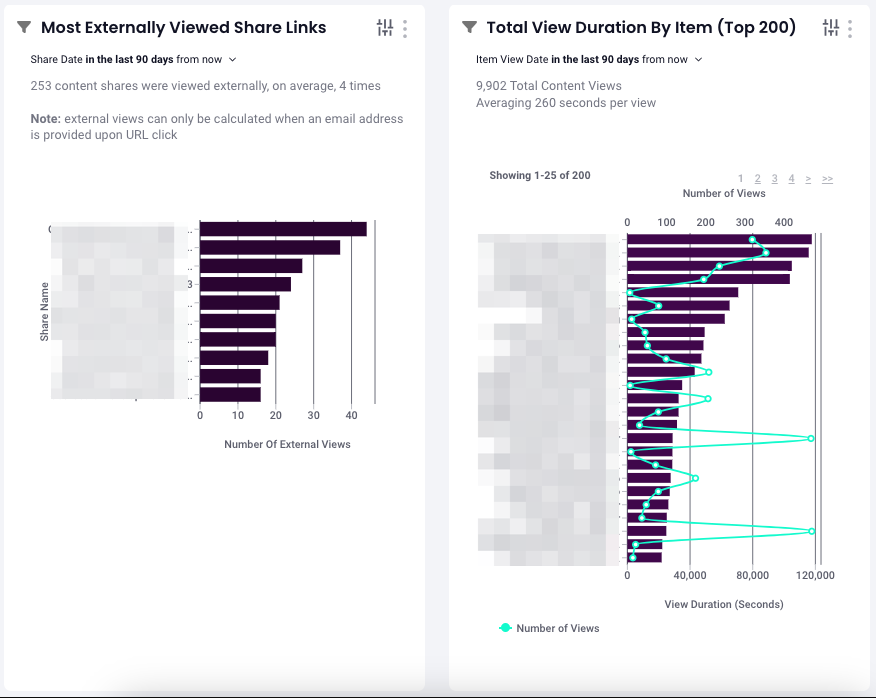
Most Externally Viewed Share Links (Bar Chart)
- Total View Duration by Items (Top 200) (Bar Chart)
Row 6
-
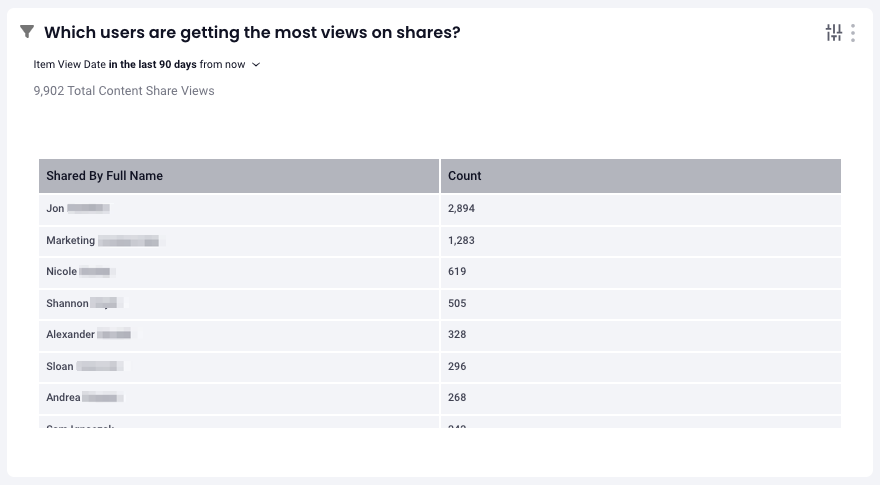
Which Users are getting the most views on shares? (Table)
Row 7
-
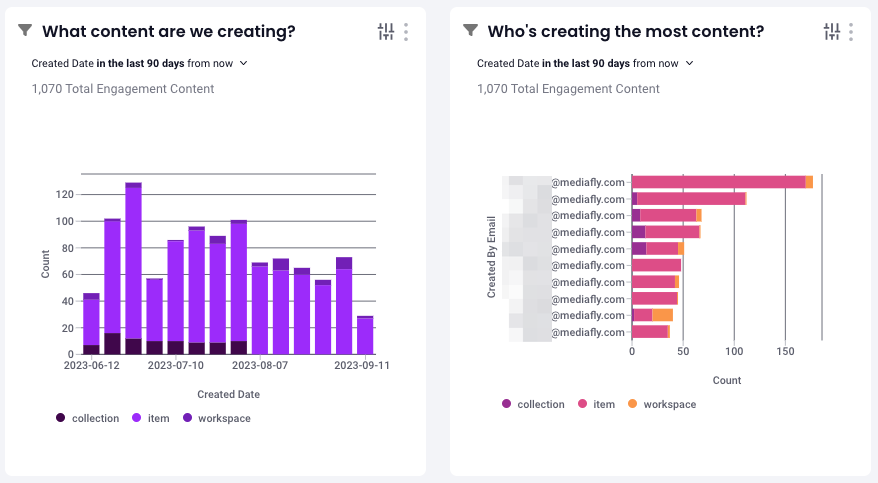
What content are we creating? (Bar Chart)
- Who's creating the most content? (Bar Chart)
Row 8
-
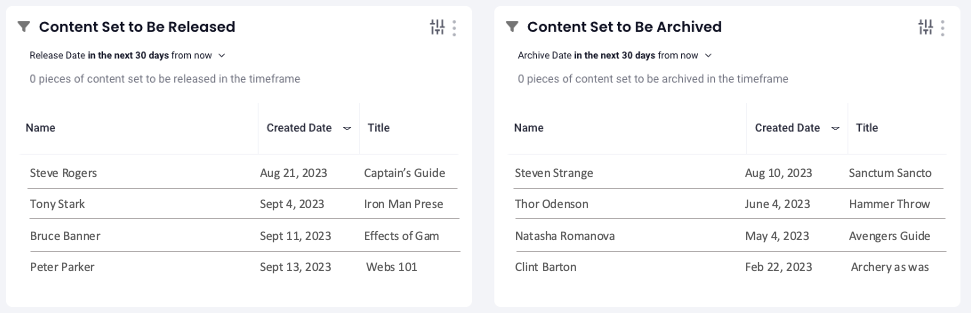
Content Set to be Released (Table)
- Content Set to be Archived (Table)
How did we build this dashboard template for you?
The Engagement Analytics Dashboard has been created for you out of the box using the configurations listed below. We love being able to provide this Dashboard out of the box and ready to use, but it's always good to know what data you're working with when you hit the ground running.
Dashboard Configuration
-
Base Template: Engagement Analytics
-
Content-Type: Engagement Content
Filters on Report Drills
Clicking on a card will produce an inspection report so you can drill down on a card's specific data. Each report comes with our recommended best practice filter sets (report columns) that can be customized to best fit your process. Read Interactive Filters to learn more!
If you run into any issues, please contact support.
Replies have been locked on this page!