
The Monthly Forecast 1:1 Review Dashboard has been created and configured for you right out of the box, so your manager and their reps have a built-in dashboard to review all pipeline that can be closed during the current quarter.
About the Monthly Forecast 1:1 Review Dashboard
What data is included? Opportunities / Forecast / Product
Who should use it? Leaders, Managers, Reps
When to use it? First week of every month for sales cycles 30 days or greater (more often if shorter sales cycle).
Why use it? Process to manage all forecast reviews to validate a forecast 1st week of each month. Standardize reporting across all levels of the sales org.
Usage by Persona
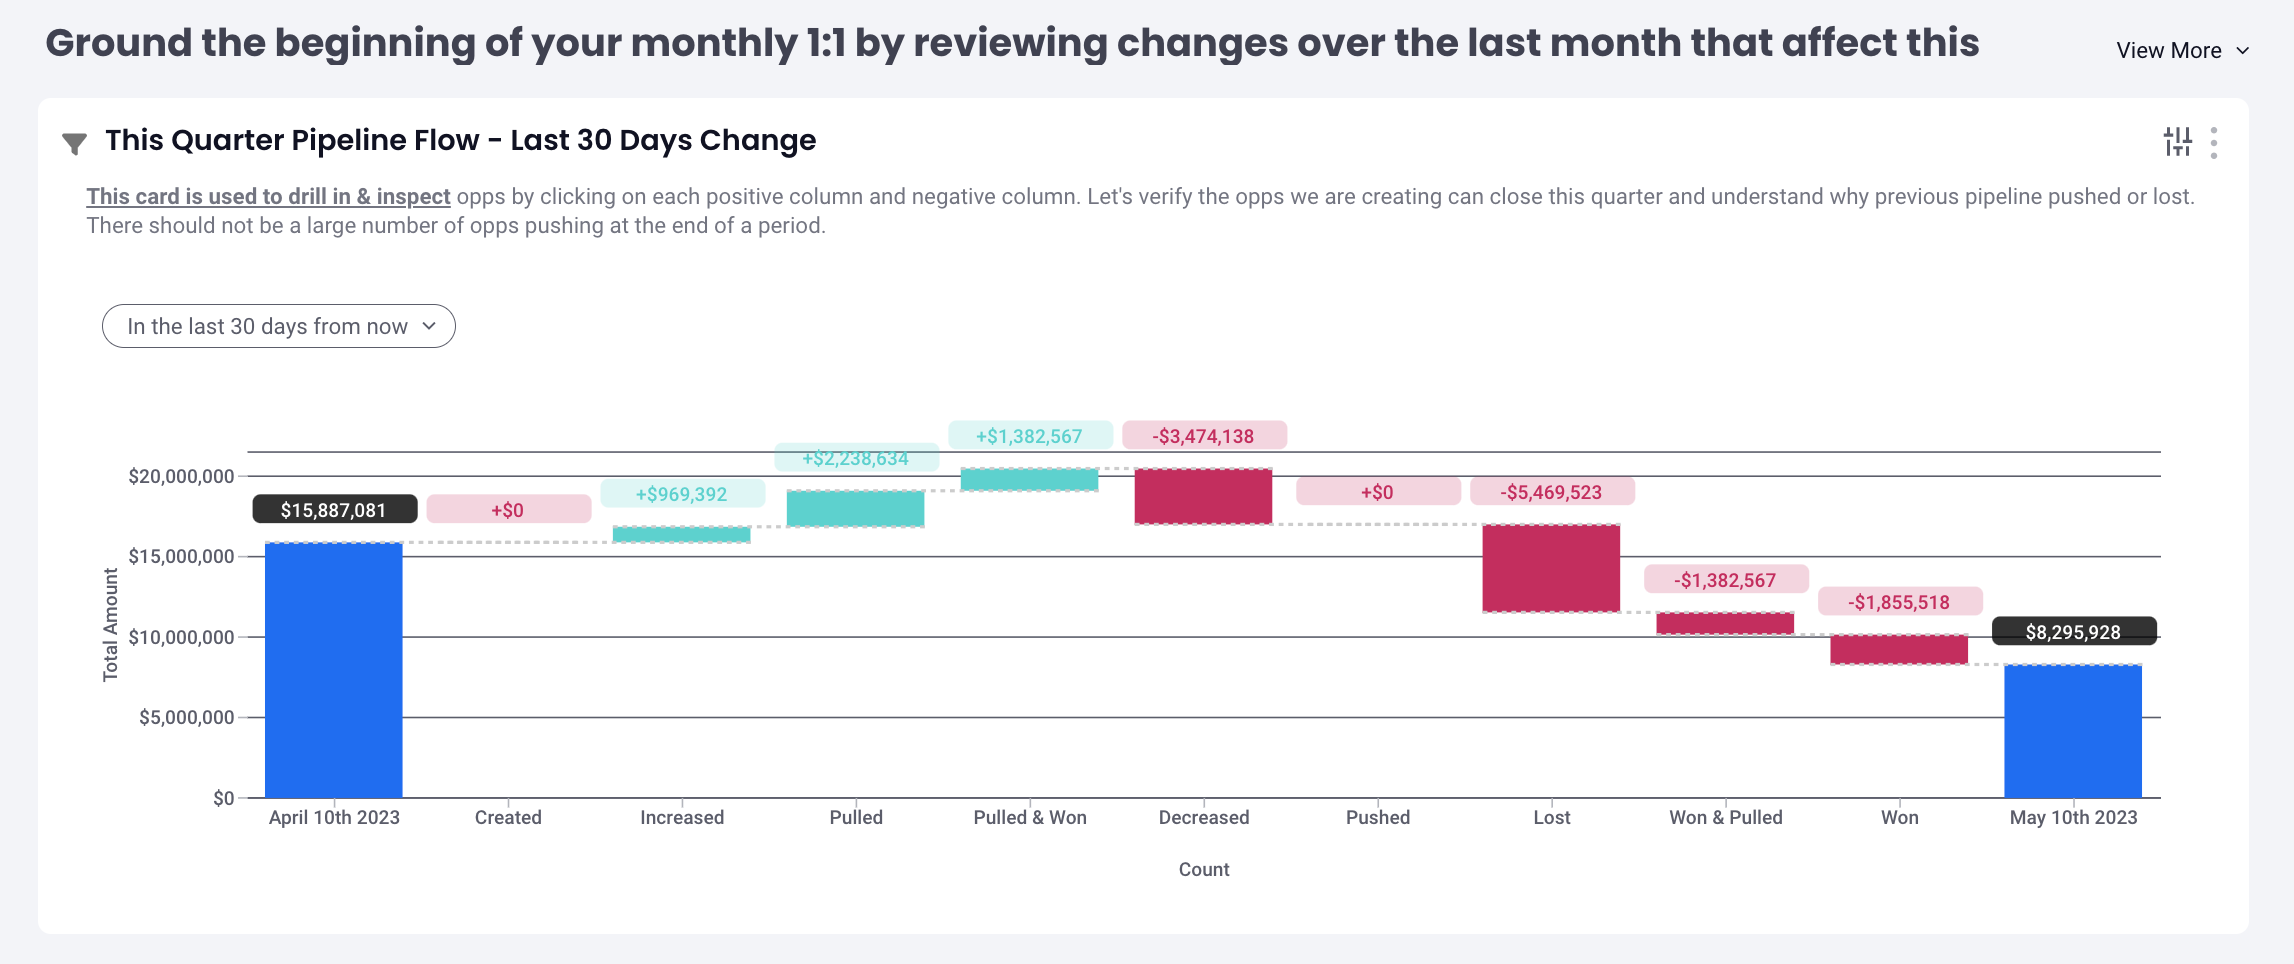
Managers schedule calls with each rep individually for the first few days of each month. They will spend an hour or more reviewing all pipeline that can be closed during the current quarter. First, we ground ourselves in how that current period forecast & pipeline is changing, and ensure the opportunities in our pipeline are properly staged based on their forecast category or stage criteria. Most important we push or close any opportunities that we do have a clear plan of action to close in the quarter. This close date hygiene is critical as all open pipeline with a close date in the quarter will be reviewed in the weekly commit standup. Managers will ensure that reps in 1st week of each month (Monday-Wed) have a validated forecast. At the end of the 1st week (Thurs & Friday) managers will meet with sales leadership to review team forecasts. sales leaders can then have the final forecast presented to the board at the end of the 1st week of each month for the quarter.
- Leaders - Have confidence in the pipeline and forecast presented for the period
- Utilizing the same reporting methods, leaders, first-line managers, and reps are aligned on what is being forecast for the period. Managers can monitor team and reps' progress through the period
- Reps get coaching to ensure their forecast is achievable. With the manager's assistance, we identify gaps to achieve our goal, review opportunities at risk, and develop action plans.
Dashboard Focus:
- Is this going to close this period? Push or close any opp that you do not have a strategy to close CQ
- What is my current forecast? Review booked, committed, and what is in upside as coverage to exceed our goals
-
What’s changed? See progression of opportunities, forecast trend & how we are tracking toward our goals
Definitions:
Intelligence Forecast, Forecast Submission & FS = Intelligence Forecasting Tool
CQ = Current Quarter
Before you start ,consider:
You need to come into a forecast review ready to provide your judgment. Think about a forecast review process as a learning process. How do I get better at delivering a quality funnel at the beginning of a month and make sure my data is clean so that I am able to gain the insights from my manager and the coaching necessary to convert or advance as much of this funnel through the sales process?
Pro tip: Sort all cards by amount (Largest Top)
The Monthly Forecast 1:1 Review Dashboard
The following rows and cards make up the template of reports we consider best practice for a manager Forecast 1:1 Review Dashboard. Each card can be opened with one click to further inspect data with a more focused view on a particular report.
We recommend having your Monthly Forecast 1:1 Review dashboard open in another window as you walk through this guide.
Row 1: Ground the beginning of your monthly 1:1 by reviewing changes over the last month that affect this quarter.
- This Quarter Pipeline Flow - Last 30 Days Change (Waterfall / Flow)
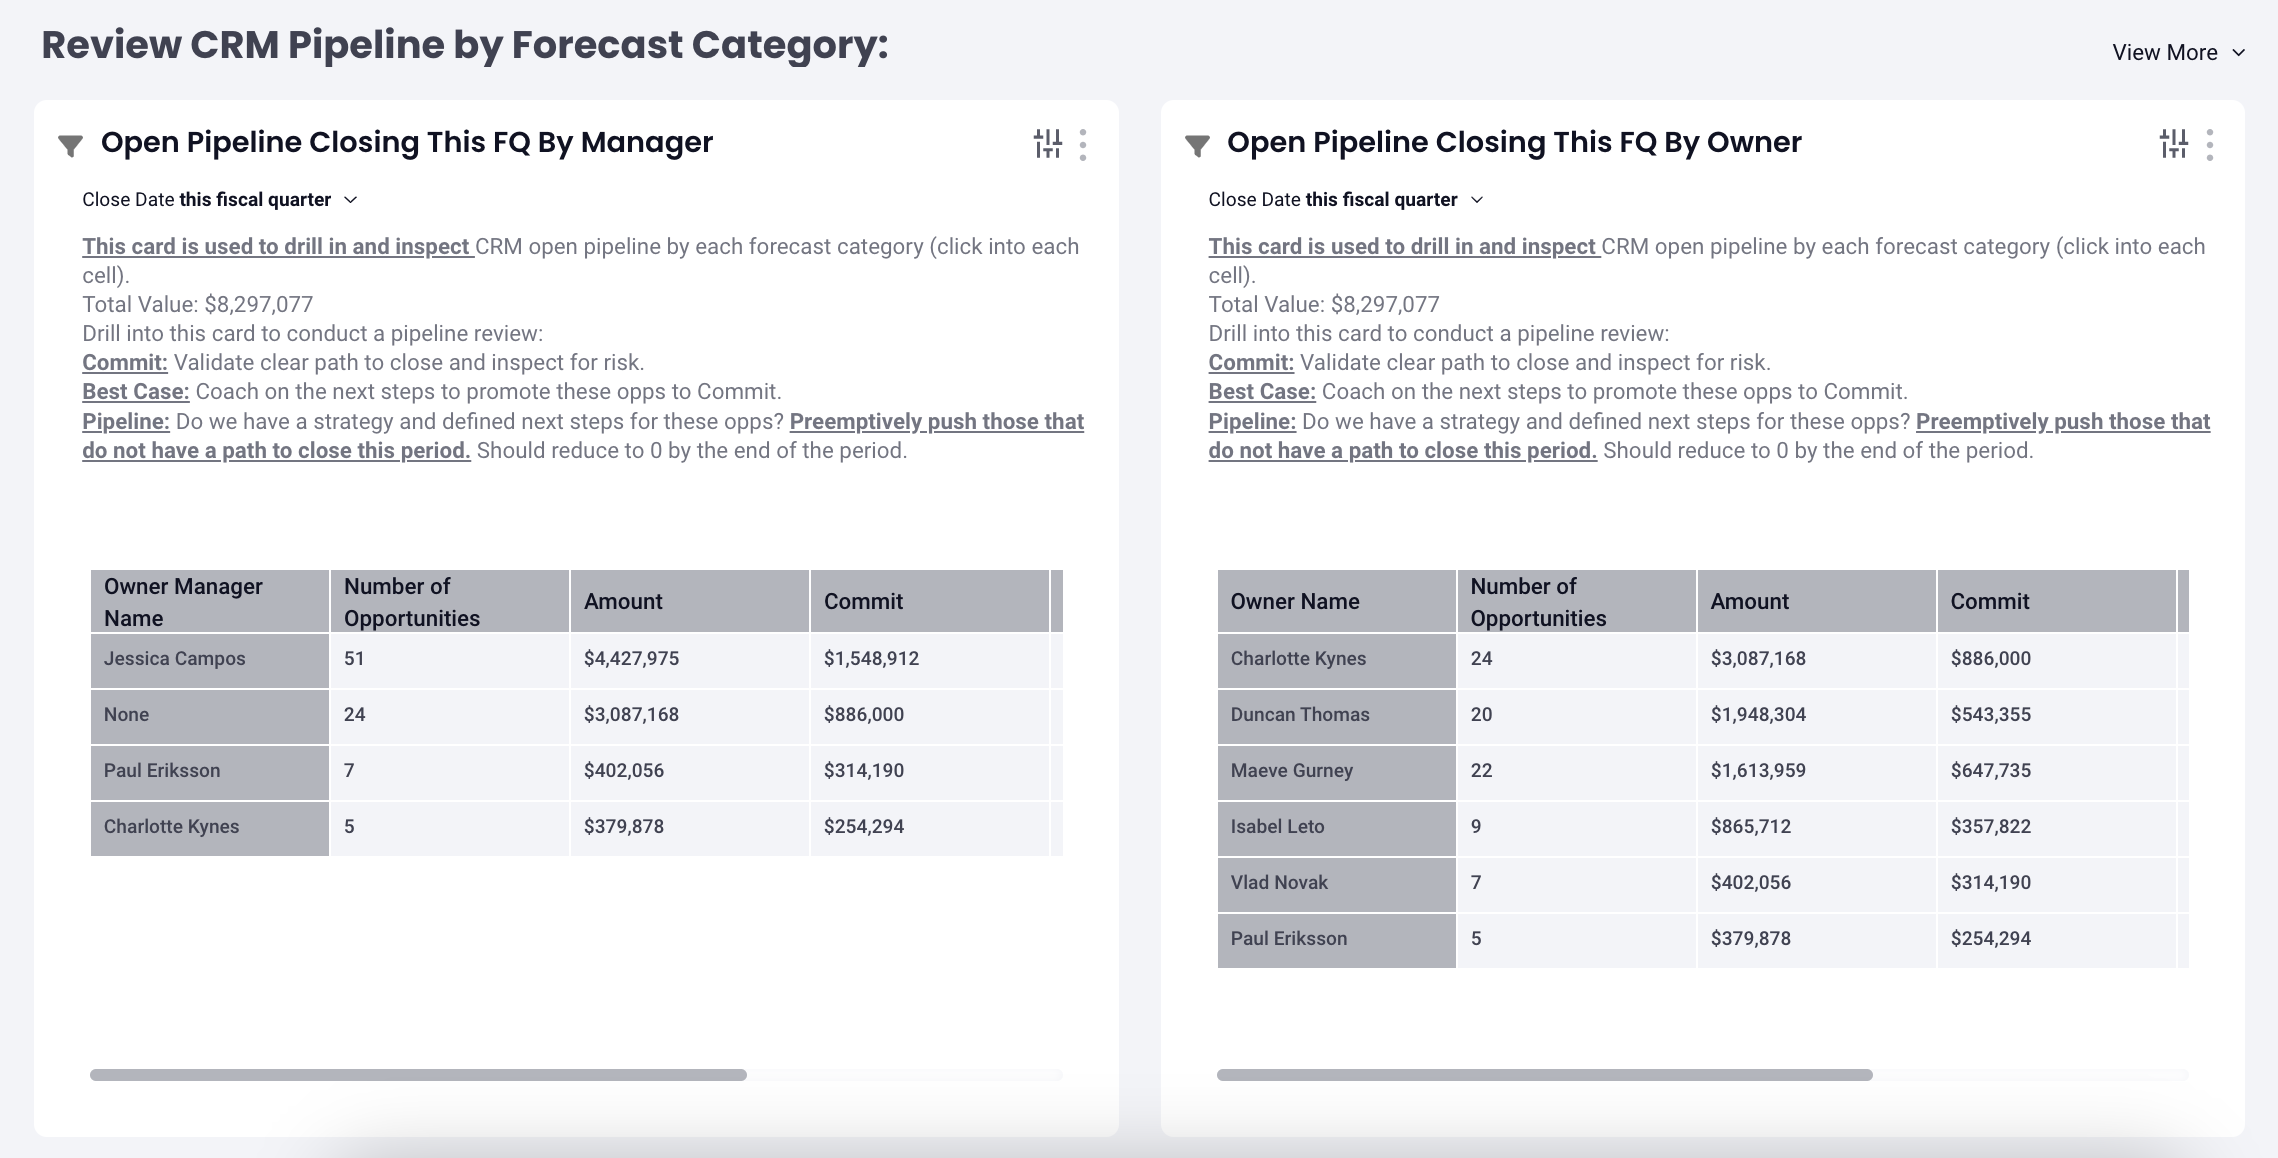
Row 2: Review CRM Pipeline by Forecast Category
- Review CRM Pipeline by Forecast Category (Bar Chart Grid View)
- Open Pipeline Closing this FQ by Owner (Bar Chart Grid View)
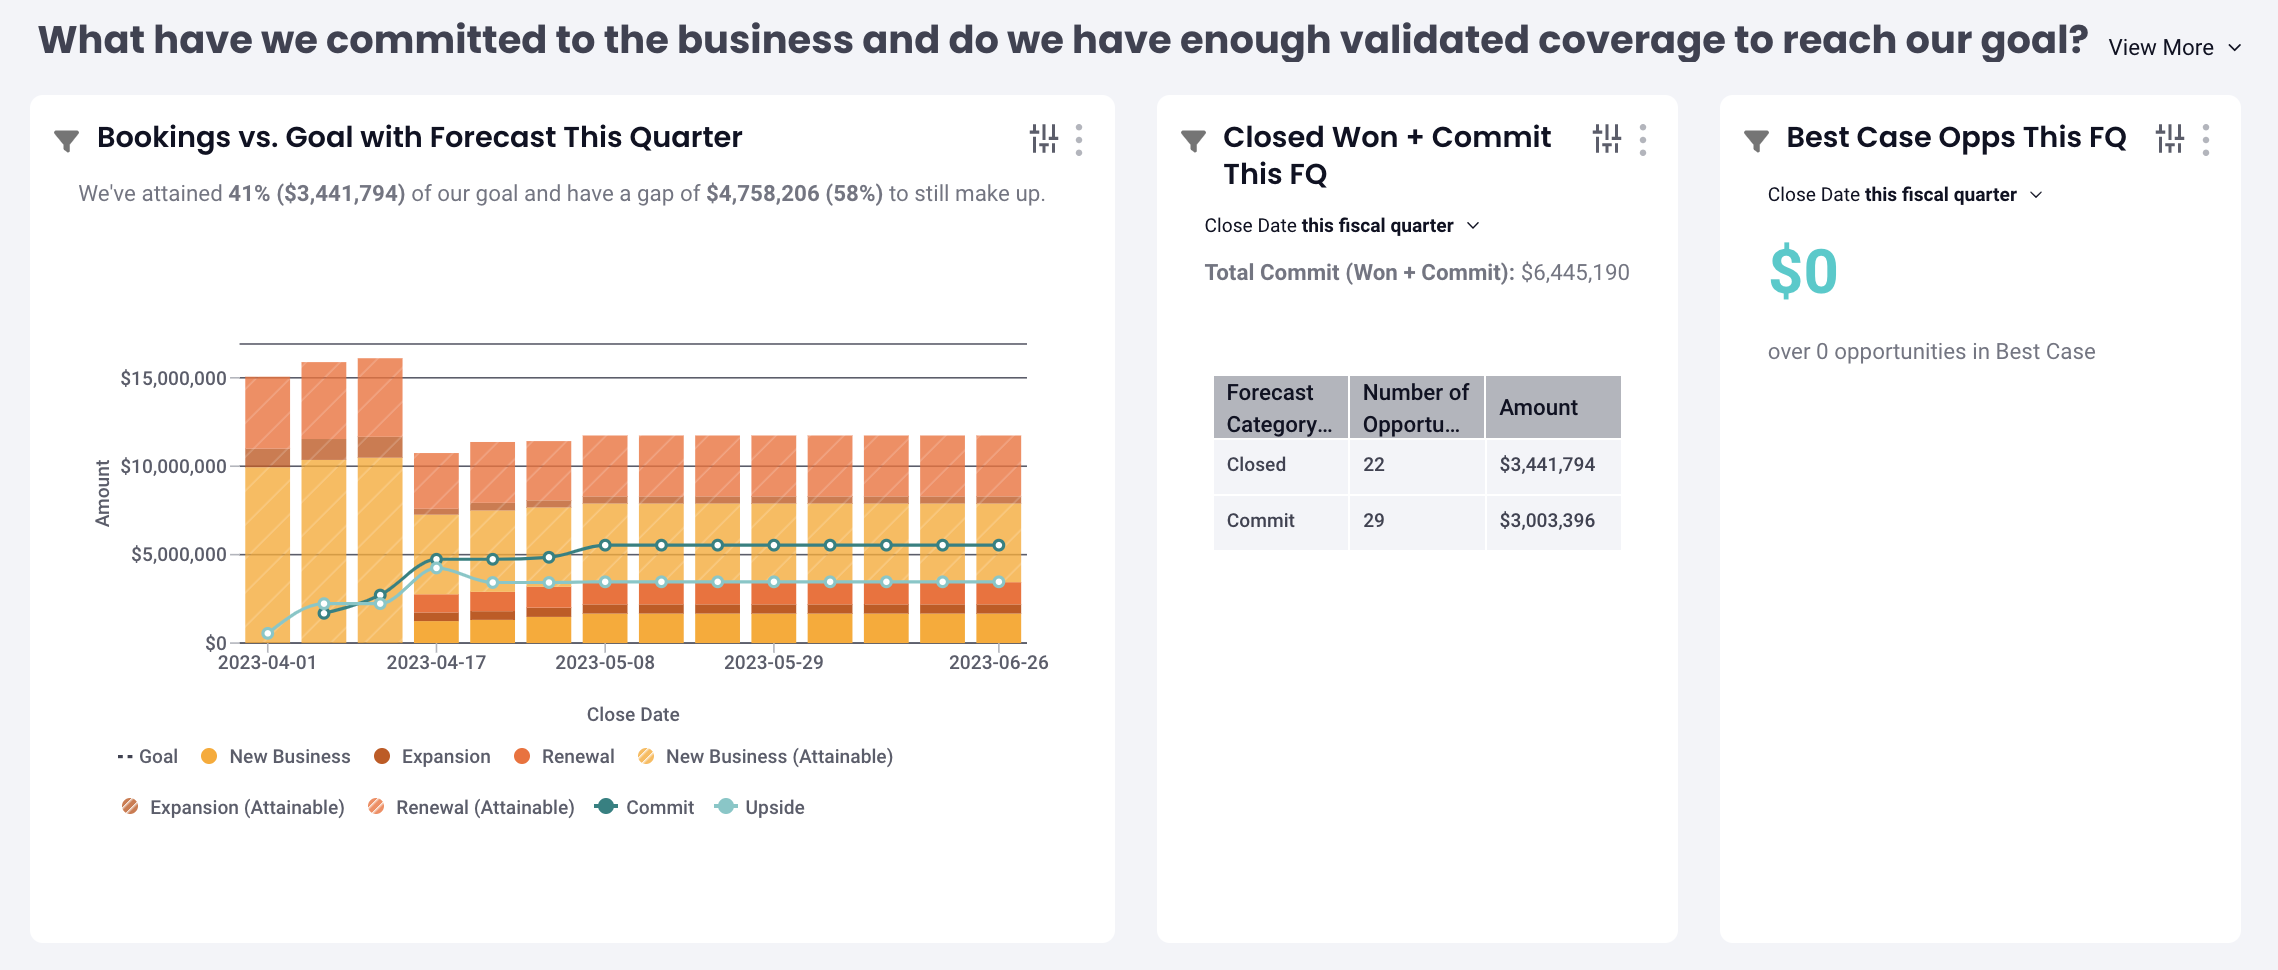
Row 3: What have we committed to the business and do we have enough validated coverage to reach our goal?
- Bookings vs. Goal with Forecast this Quarter (Bar Chart with Goals)
- Closed Won + Commit this FQ (Bar Chart Grid View)
- Best Case Opps this FQ (Headline)
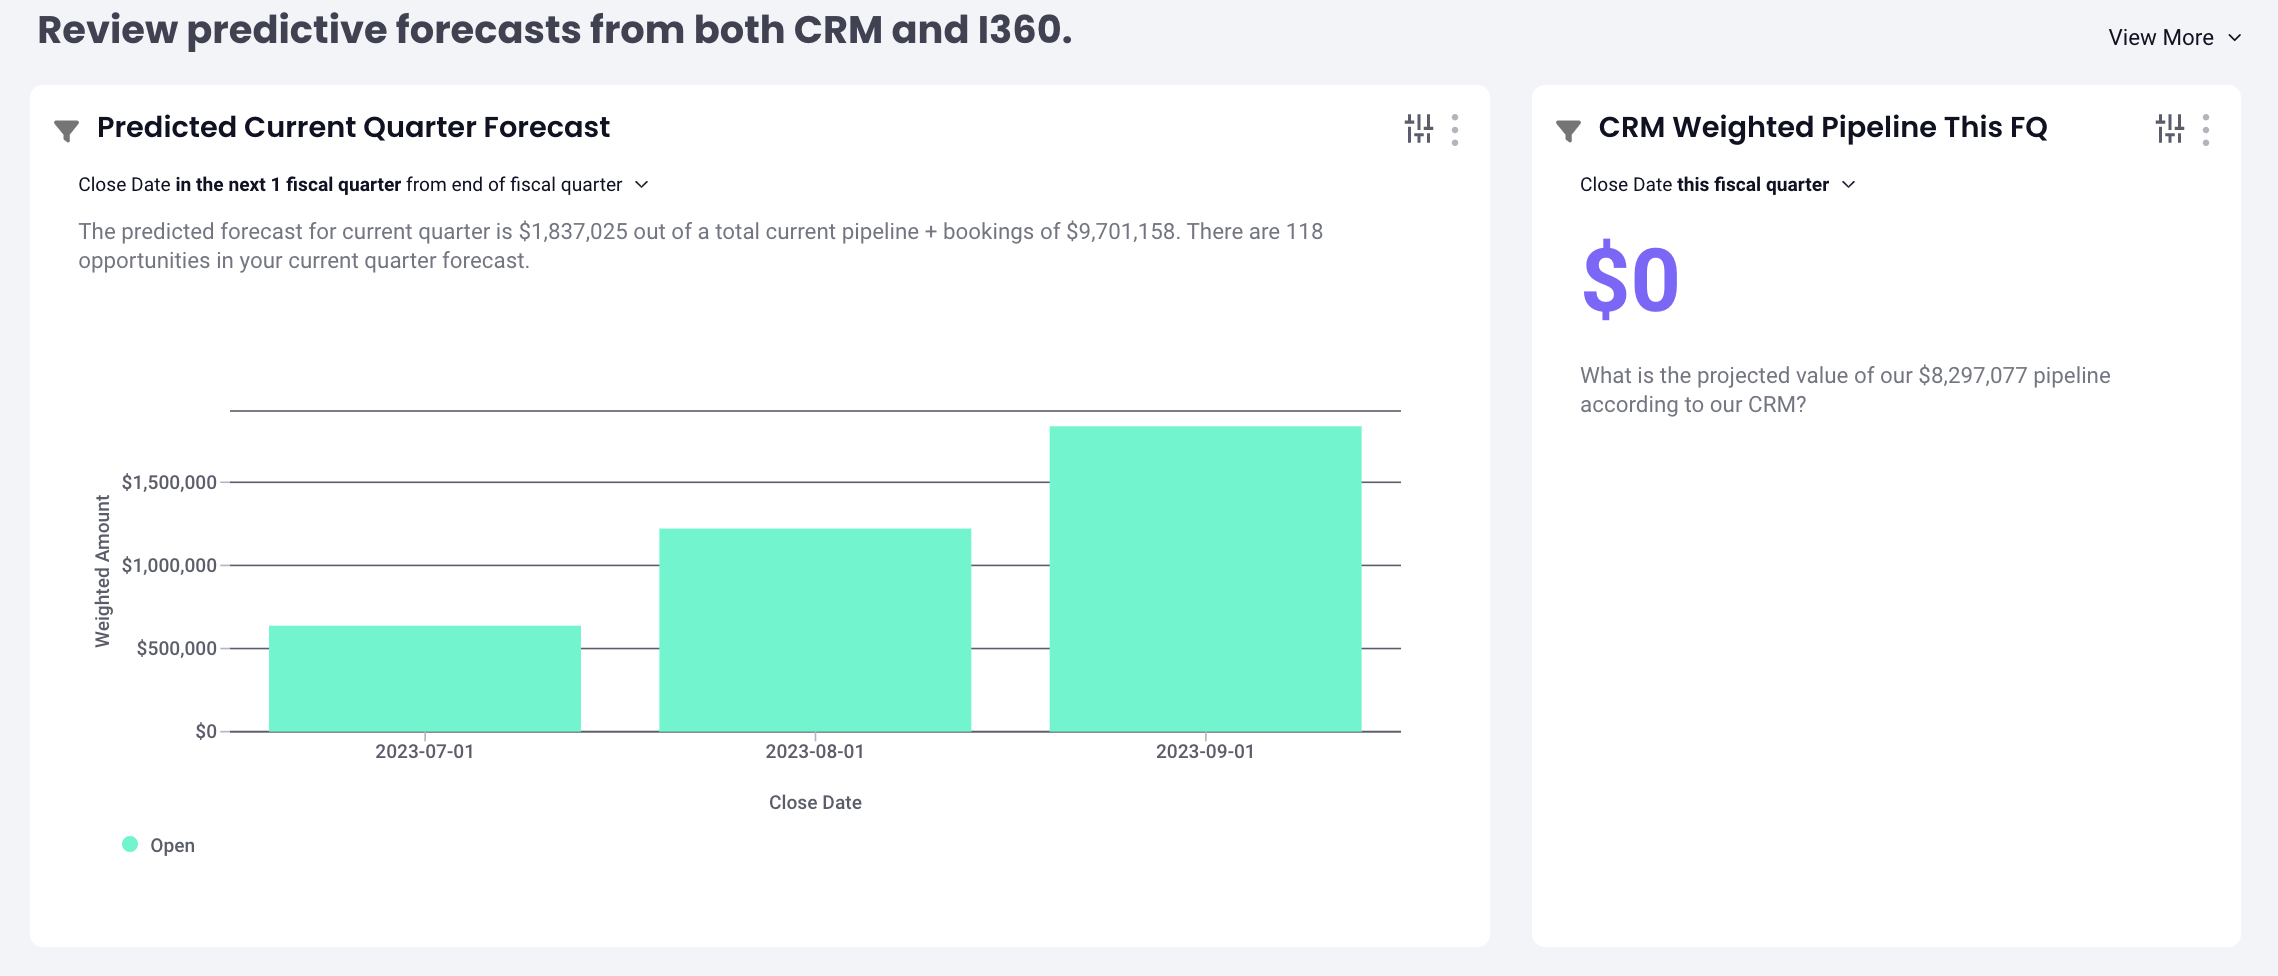
Row 4: Review predictive forecasts from both CRM and Intelligence
- Review predictive forecasts from both CRM and Intelligence (Bar Chart)
- CRM Weighted Pipeline this FQ (Headline)
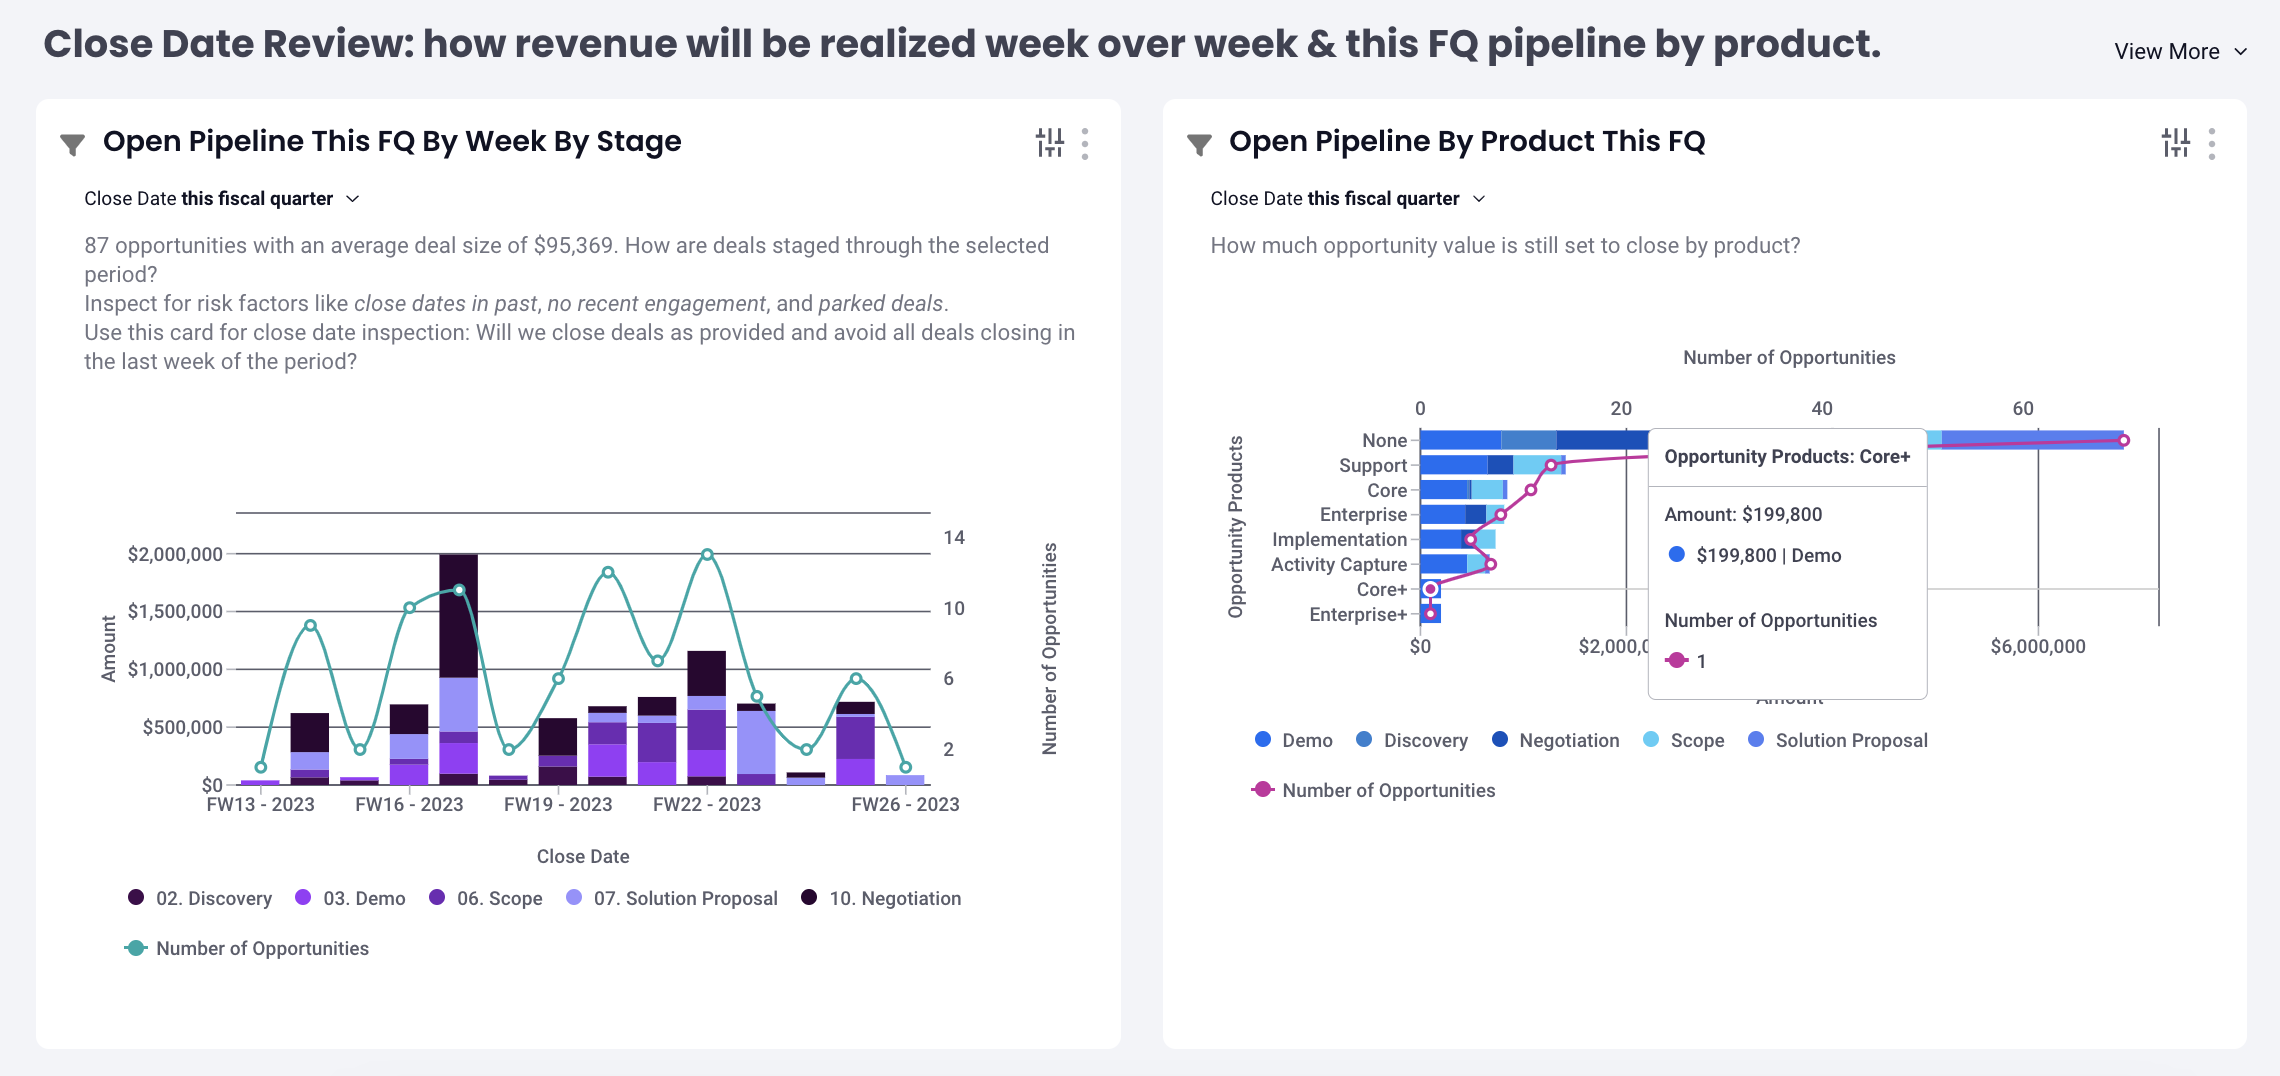
Row 5: Close Date Review: how revenue will be realized week over week & this FQ pipeline by product
- Open Pipeline this FQ by Week by Stage (Bar Chart)
- Open Pipeline by Product this FQ (Bar Chart)
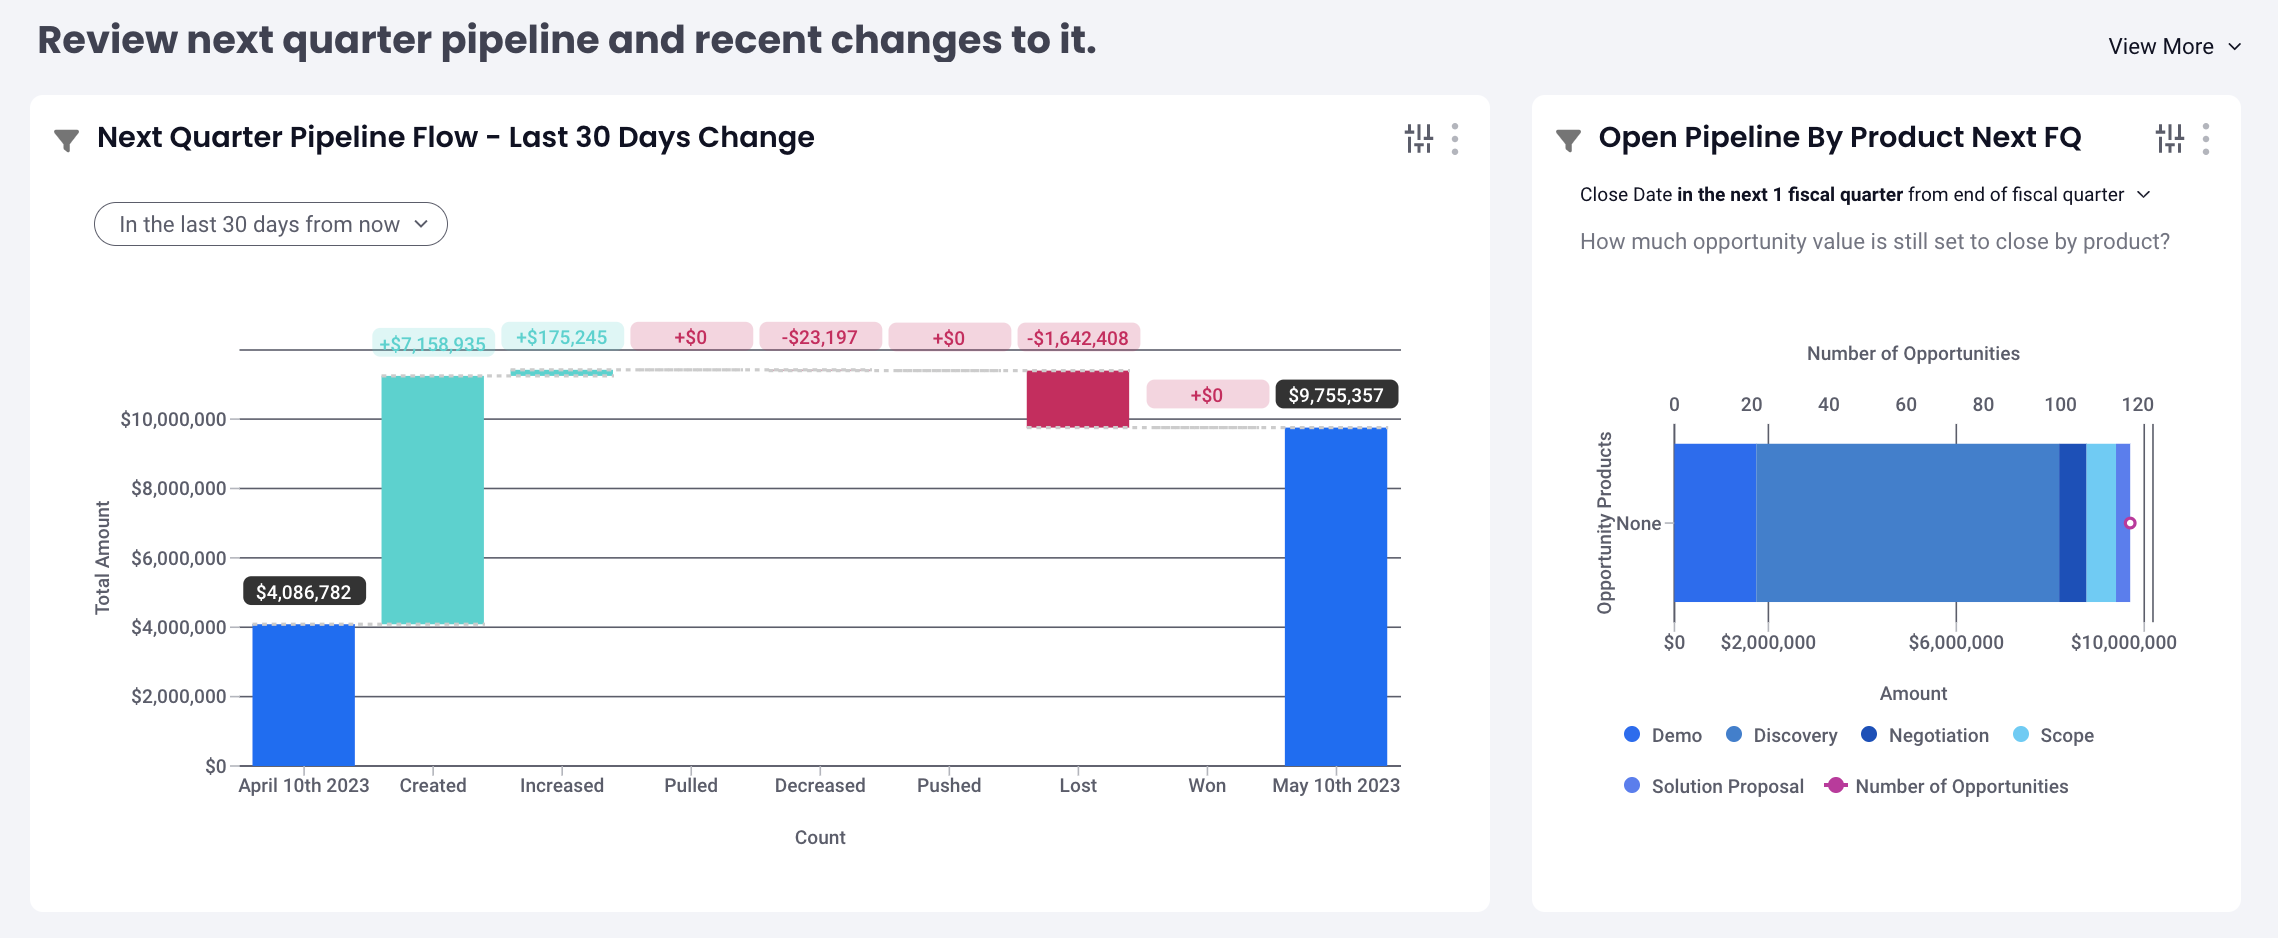
Row 6: Review next quarter pipeline and recent changes to it
- Next Quarter Pipeline Flow - Last 30 Days Change (Waterfall / Flow)
- Open Pipeline by Product Next FQ (Bar Chart)
If you run into any issues, please contact support.
Replies have been locked on this page!