
Intelligence provides a flexible model configuration and report generation process. This allows tweaking the model to be specific to your business, to increase accuracy and clarity.
Note: Managing your ML models does require your CSM and Mediafly Support, but it's a straightforward process we've documented here.
Managing Your ML Models
There are several components of your ML models that must be managed:
Input to the Model
-
What field do you split by?
-
What fields do you incorporate in the ML model generation?
Output
-
Review the output report for accuracy and predictability
Input to the Model
-
You can read more about changing your split by here.
-
You can read more about adding fields to the model config here.
-
You can also add and remove fields from the model generation process.
-
Note: Open a support ticket
-
Intelligence provides an interface to manage the ML model for you. In the example below, you can see the fields available to be added or removed from the model.
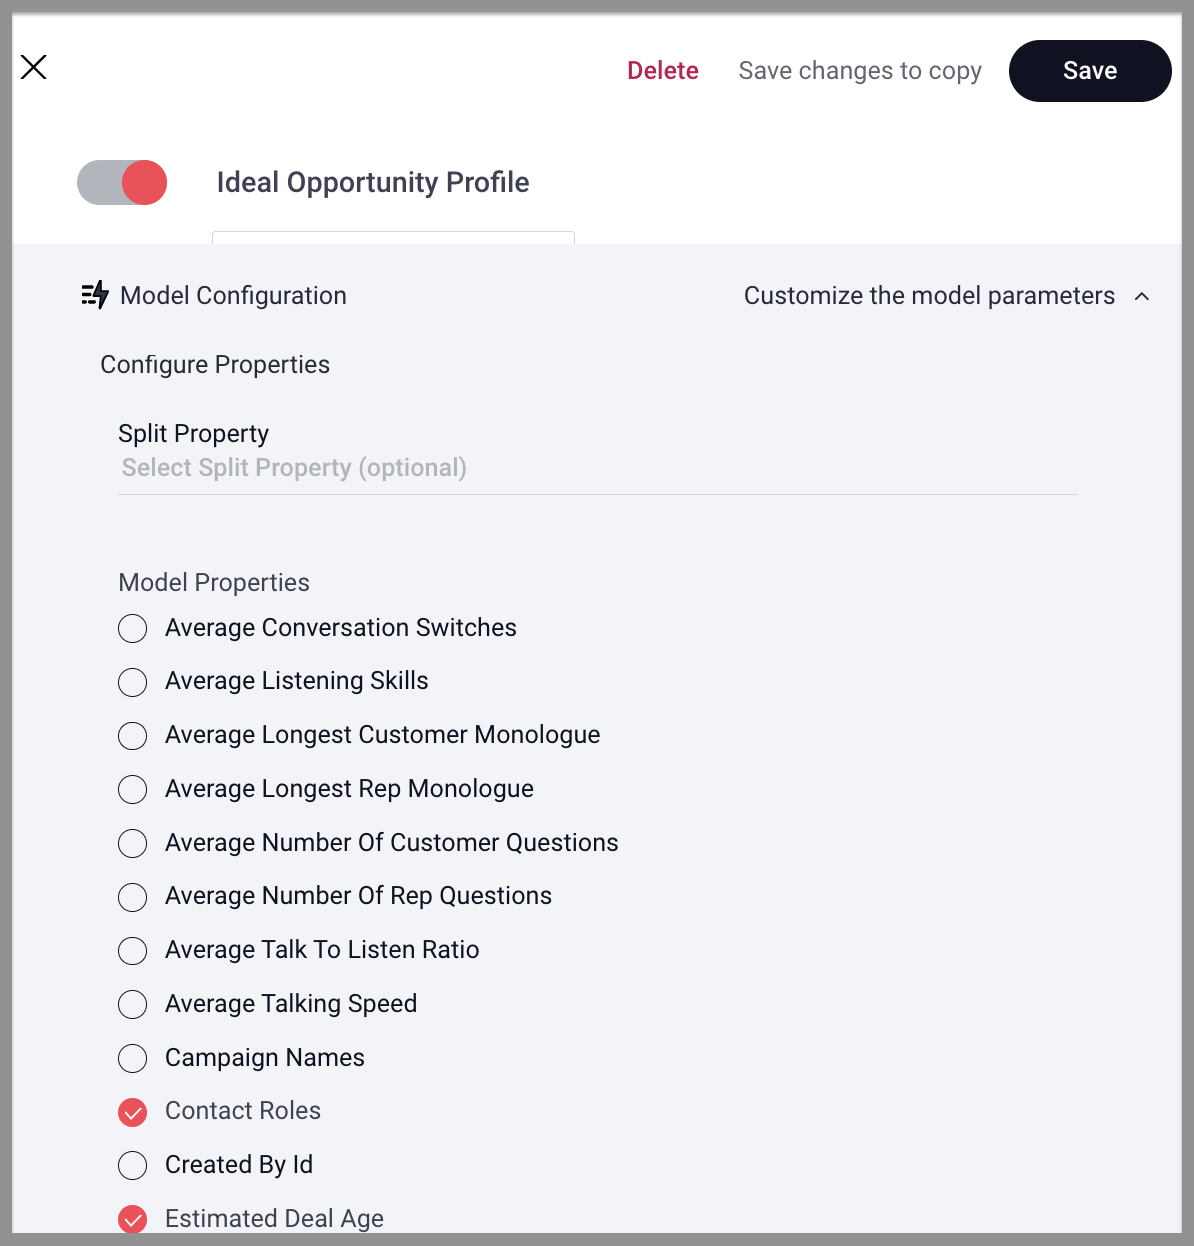
Note: adding and removing fields from the model should be targeted to IMPROVE THE ACCURACY OF THE MODEL. Let the data tell you what to use.
Adding a field to the model is as simple as checking the box.
Note: if you don't see a field you want, review this.
Intelligence will automatically generate a new model when changes are made, or once a week. Each model produces a new output report (you can request this from your CSM).
Output Report Review
You will receive a model output report from your CSM. There are two sections that will need to be reviewed:
Model Accuracy Assessment
Note: >90% is acceptable for management purposes, >75% is directionally correct, but will have too many false positives/negatives for management.
-
>75% accurate directionally correct models can be used for rollup reports, but not record level inspection
-
>90% accurate models can be used for record-level inspection and coaching
|
|
Opp Type |
Accuracy |
Training Data |
Winning % in Sample |
Confusion Matrix |
|
New Business |
97% |
1923 of 2239 |
33.2% won |
True Positive: 208 False Negative: 8
|
False Positive: 51 True Negative: 1657 |
|
Renewal |
91% |
754 of 845 |
82.1% won |
True Positive: 481 False Negative: 48 |
False Positive: 20 True Negative: 205 |
|
Upsell |
92% |
1302 of 1612 |
86.9% won |
True Positive: 1041 False Negative: 91 |
False Positive: 14 True Negative: 156 |
Model Details
This section of your report contains more details of the model built for each split.
-
Feature: The name of the opportunity attribute. These are derived from your data and buckets by the most ideal intervals as determined by the algorithms.
-
Weight: How impactful the feature is in the calculation of the prediction.
-
Count With: Number of Opportunities of this type that contain the feature.
-
Count Without: Number of Opportunities of this type that do not contain the feature.
-
Amount With: Sum of Opportunity amount of this type that contain the feature.
-
Amount Without: Sum of Opportunity amount of this type that do not contain the feature.
-
Win Rate With: Win rate for opportunities of this type that contain the feature.
-
Win Rate Without: Win rate for opportunities of this type that do not contain the feature.
Review the features and splits for reasonableness. Machine Learning isn't smart enough to understand business context-sometimes the data is predictive, but not reasonable.
Note: Data that changes after opportunity close MUST be removed from models (i.e Contact roles that are added after a deal closed-won will distort model predictions).
Note: Any feature with 100% win rate should be reviewed and potentially removed from the model.
|
Feature |
Weight |
Count With |
Count Without |
Amount With |
AmountWithout |
Win Rate With |
Win Rate Without |
|
Activity.InboundTotal: < 12 |
5.00% |
1010 |
913 |
$232,300.00 |
$209,990.00 |
50.50% |
45.65% |
|
Activity.InboundTotal: ≥ 12 |
4.97% |
1676 |
247 |
$385,480.00 |
$56,810.00 |
83.36% |
12.29% |
|
Activity.MeetingTotal: ≤ 6 |
4.88% |
741 |
1182 |
$170,430.00 |
$271,860.00 |
36.17% |
57.69% |
|
Task.Total: < 18 |
4.87% |
916 |
1007 |
$210,680.00 |
$231,610.00 |
44.64% |
49.07% |
|
Task.Total: > 18 |
4.87% |
1264 |
659 |
$290,720.00 |
$151,570.00 |
61.51% |
32.07% |
Replies have been locked on this page!