
This article covers Data Tables and their use cases. Data Tables allow you to connect a spreadsheet to select and global variable inputs in order to perform lookups for large data sets. Here's how it works:
First, select Data Tables from the editor main screen and create a new table. You will then be asked to choose either a two-axis or a multi-axis table.
- Two-axis table is used when a single drop down is driving the values for many inputs
- Multi-axis table is used when the combination of more than one dropdown drives the value of a single field.
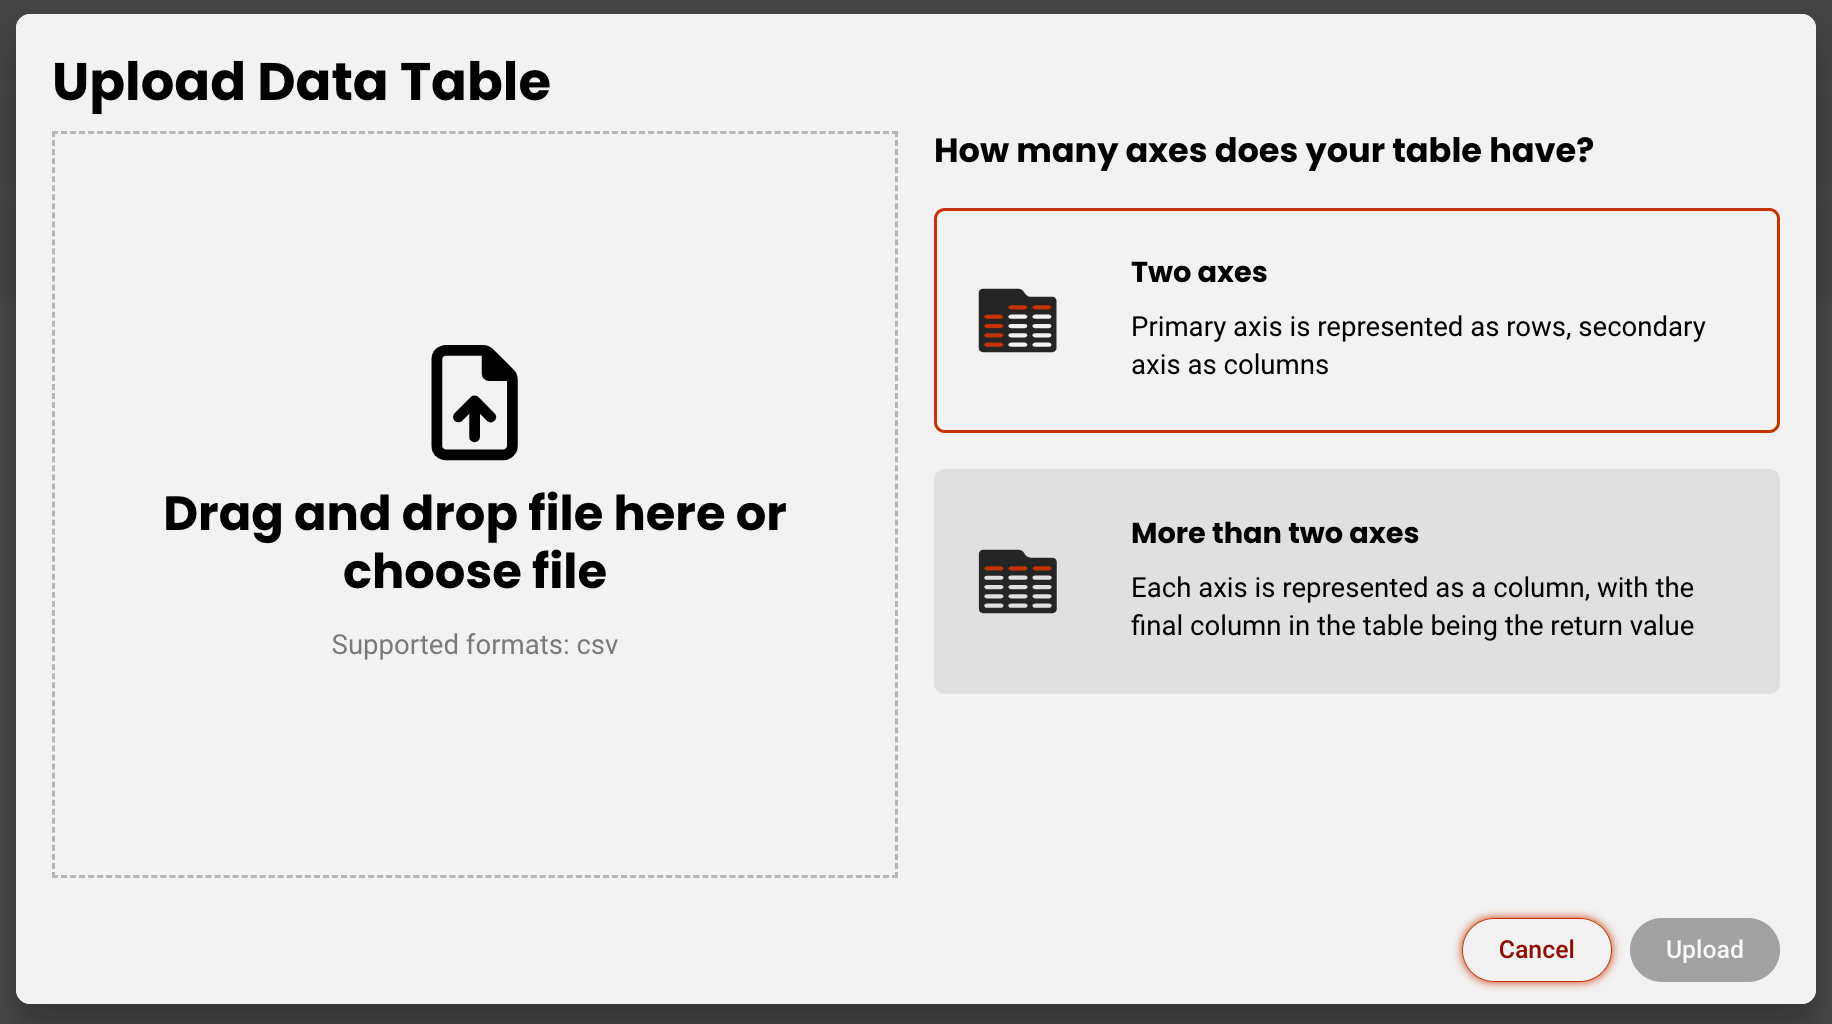
Select your preference and add your file. The file must be a CSV, and needs to be formatted correctly. Let's go through a couple examples.
Single-axis
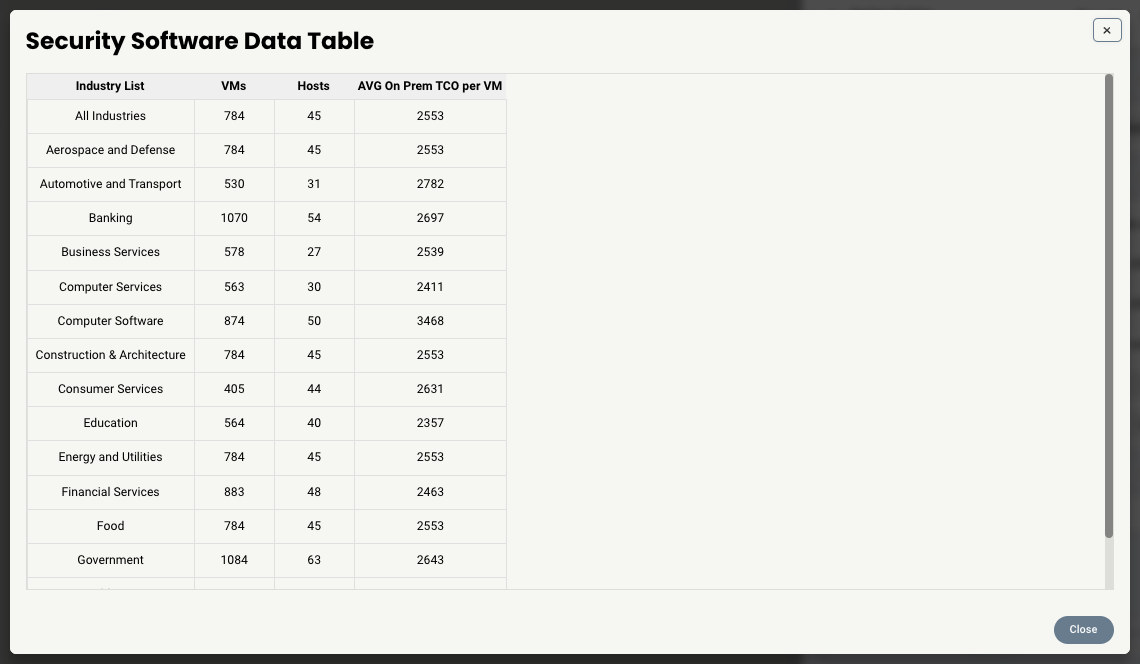
Say we want to set up a scenario where choosing an industry auto-populates values in a number of fields associated with security metrics. Here's what that table might look like:
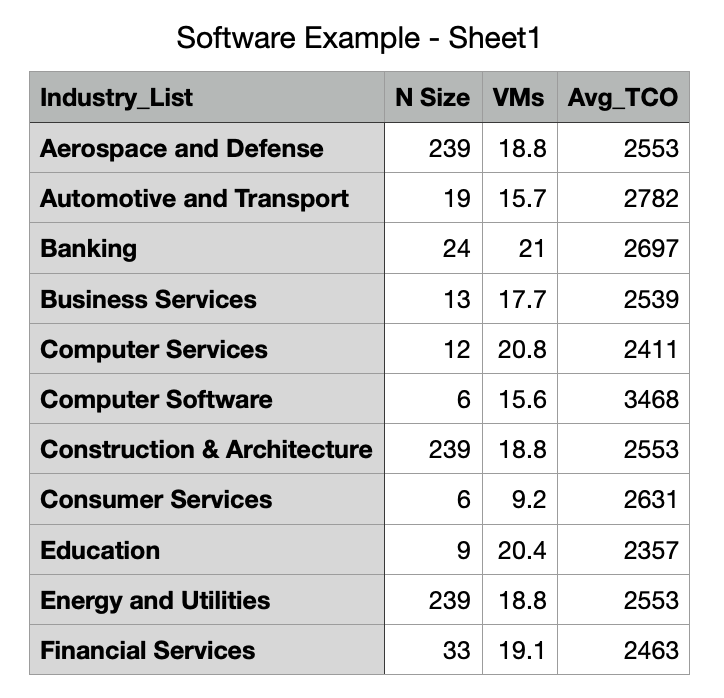
To set this up in the tool, we first need to create our items. For this example, we will need to create:
- Dropdown for Industry_List
- Global variable for N Size
- Global variable for VMs
- Global variable for Avg_TCO
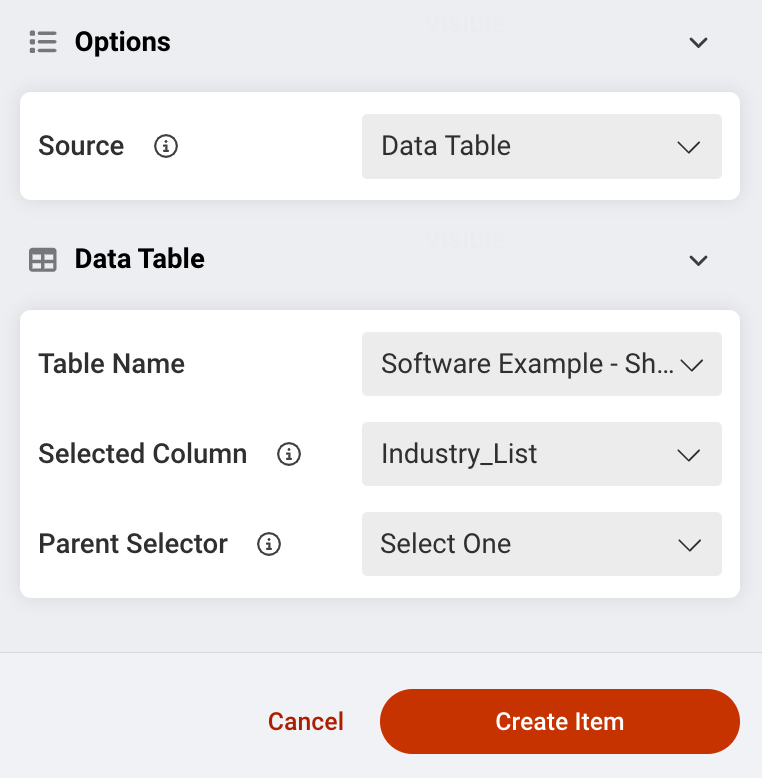
For the Dropdown, at the bottom of the tray you will select Data Table as the source, and then choose which table and columns you want to connect. For this example, you can disregard the Parent Selector picker since there is only one parent column.
For the global variables, first connect the field to a data table using the icon on the current value field
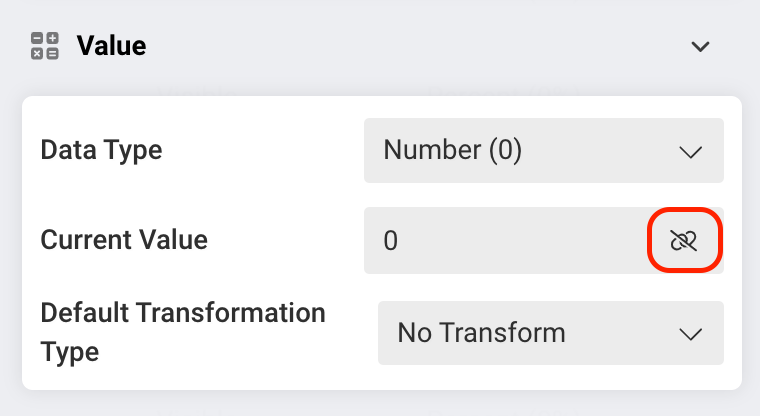
Next, you will select the Data Table and associated column you will to pull values from. Again, for single-axis tables, the parent selector will be automatically chosen. The below image shows this process for "N Size," and will need to be repeated for "VMs" and "Avg_TCO."

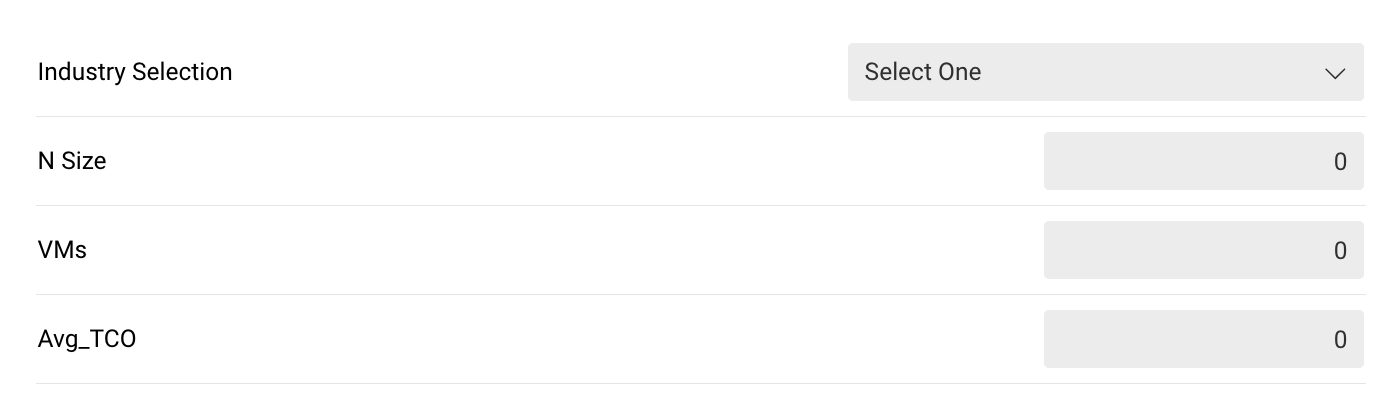
Here is everything set up on a page
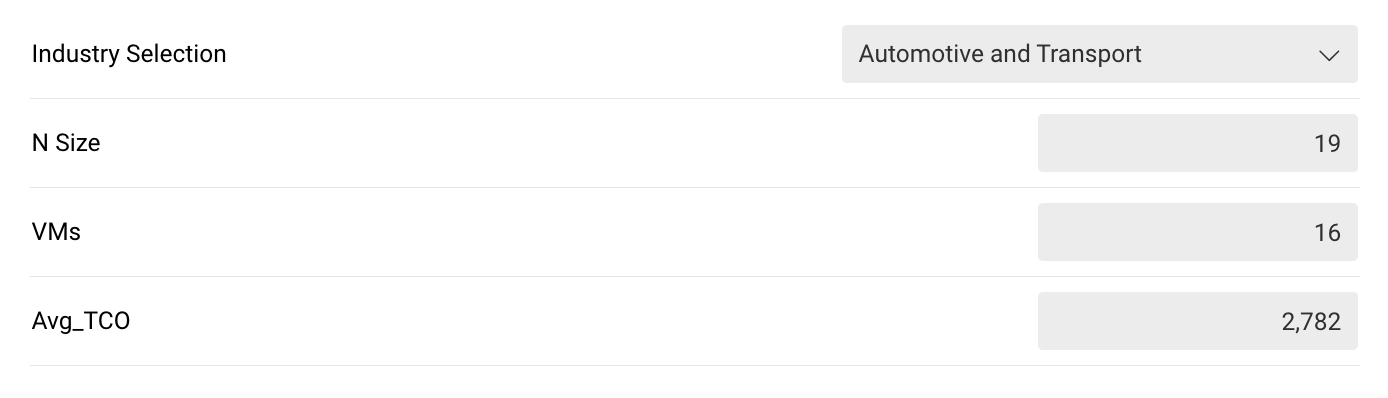
When Automotive and Transport is selected from the dropdown, you see that all the values change based on the values in your data table.
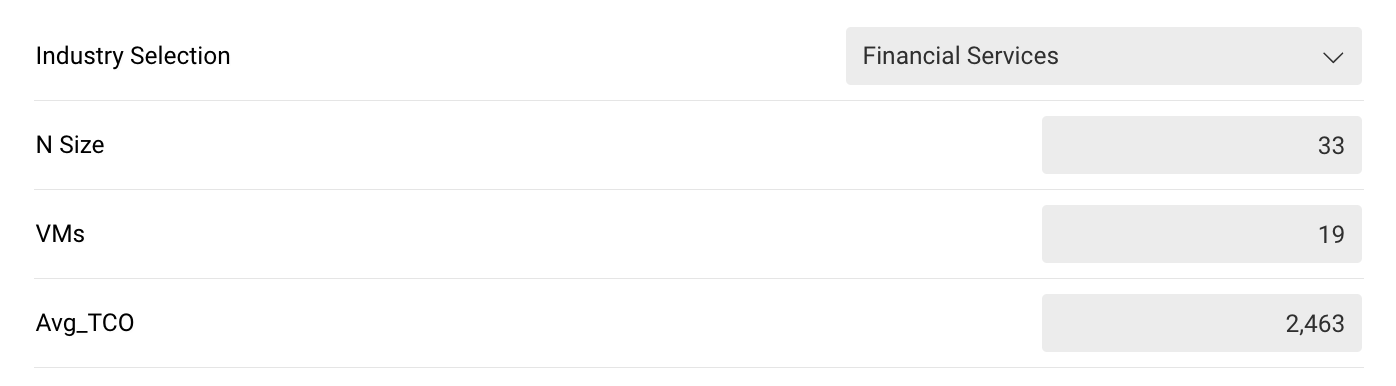
If Financial Services is instead chosen, you see that the values change to match that row in the Data Table.
Multi-axis
Say you want to create a scenario where you want to populate the value of a car based on a number of criteria. Your Data Table might look something like this, where Make, Model, and Year drive the final MSRP price.
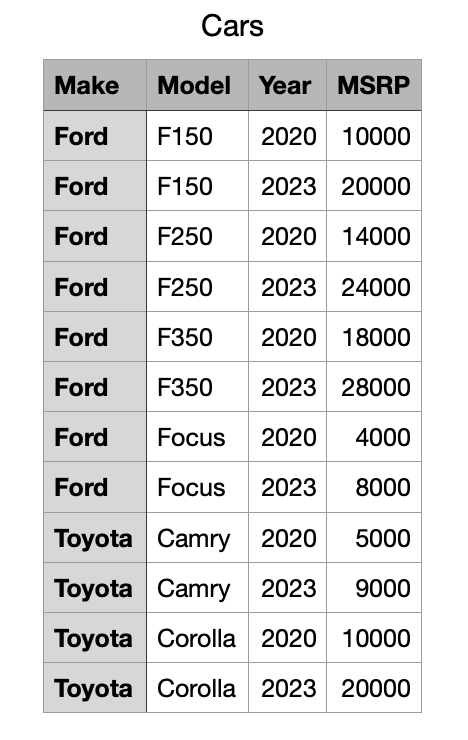
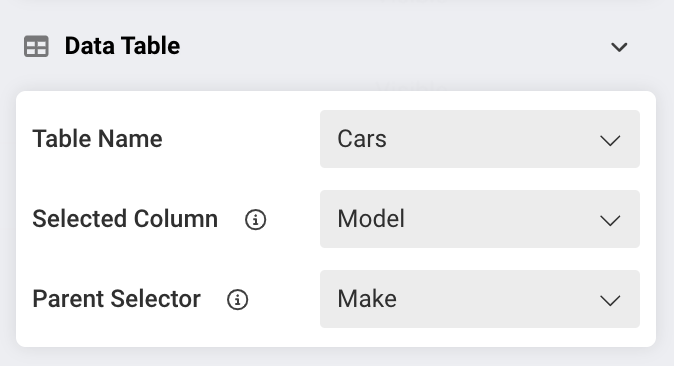
In this scenario the only difference is that for all preceding columns after the parent (leftmost), you can select which column you want to reference in order to pull the right value. In this example, the Model dropdown is dictated by the selection in the Make dropdown.
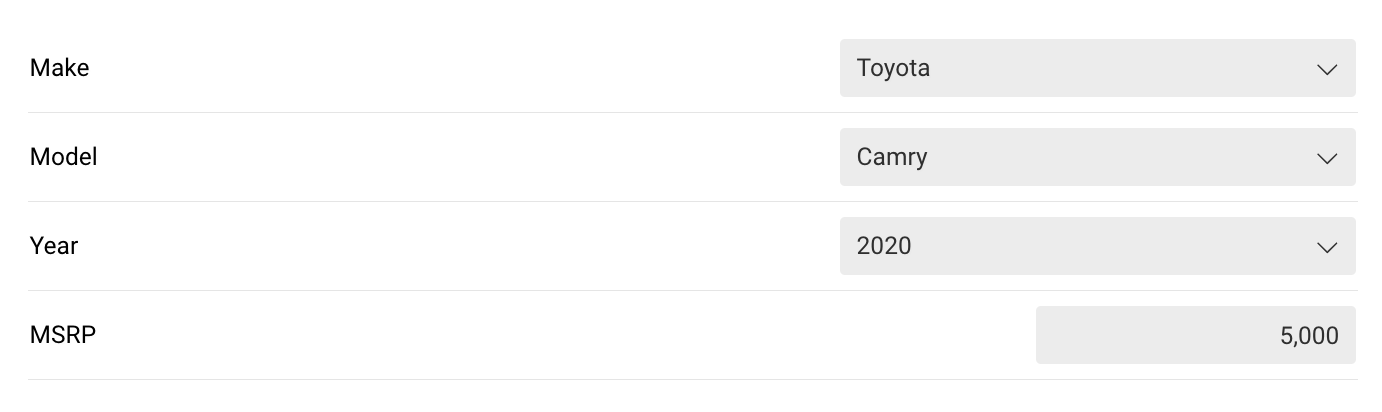
If we select Toyota, Camry, and 2020, we get this result
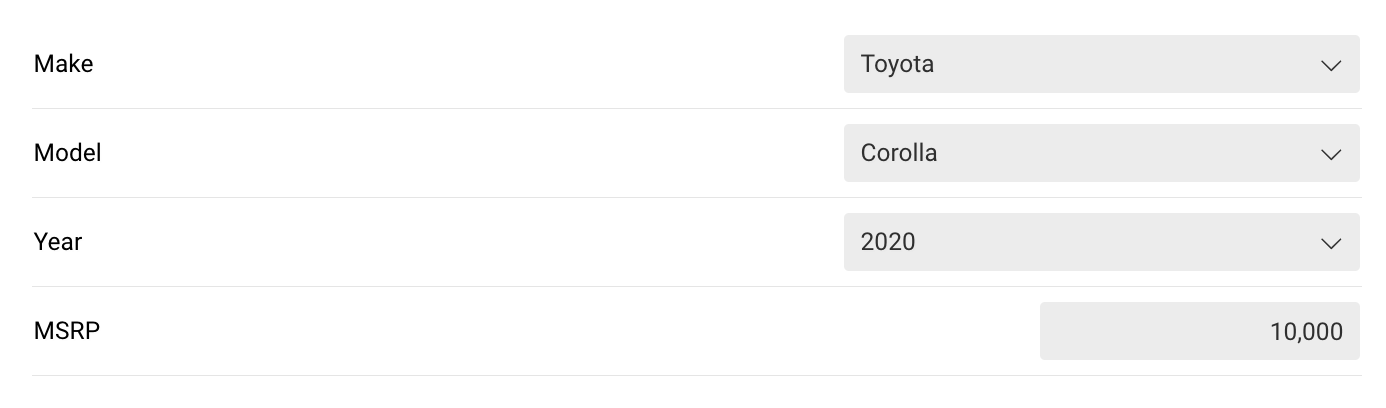
If we instead select Toyota, and Corolla, and 2020, we get this result
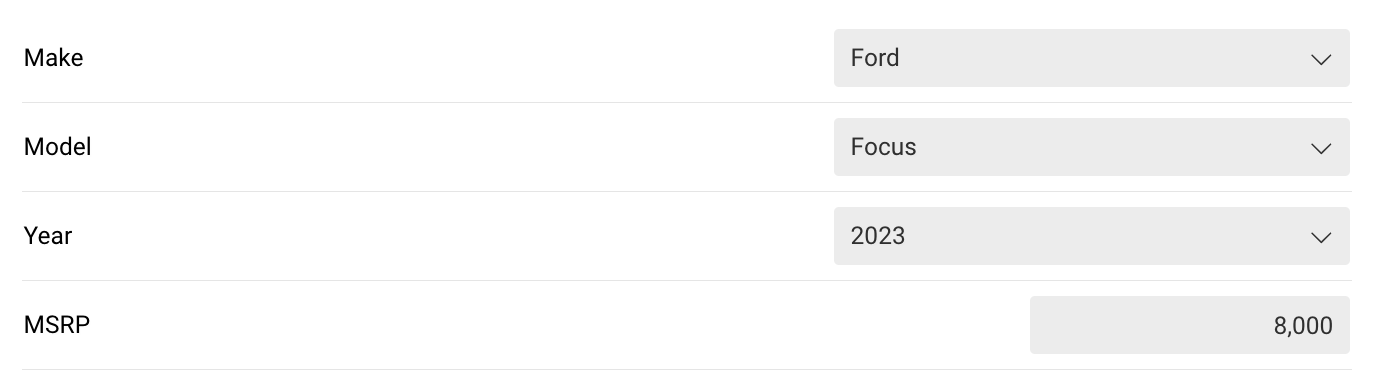
If we were to switch Toyota to Ford and make new selections, we get another result
Editing tables and troubleshooting
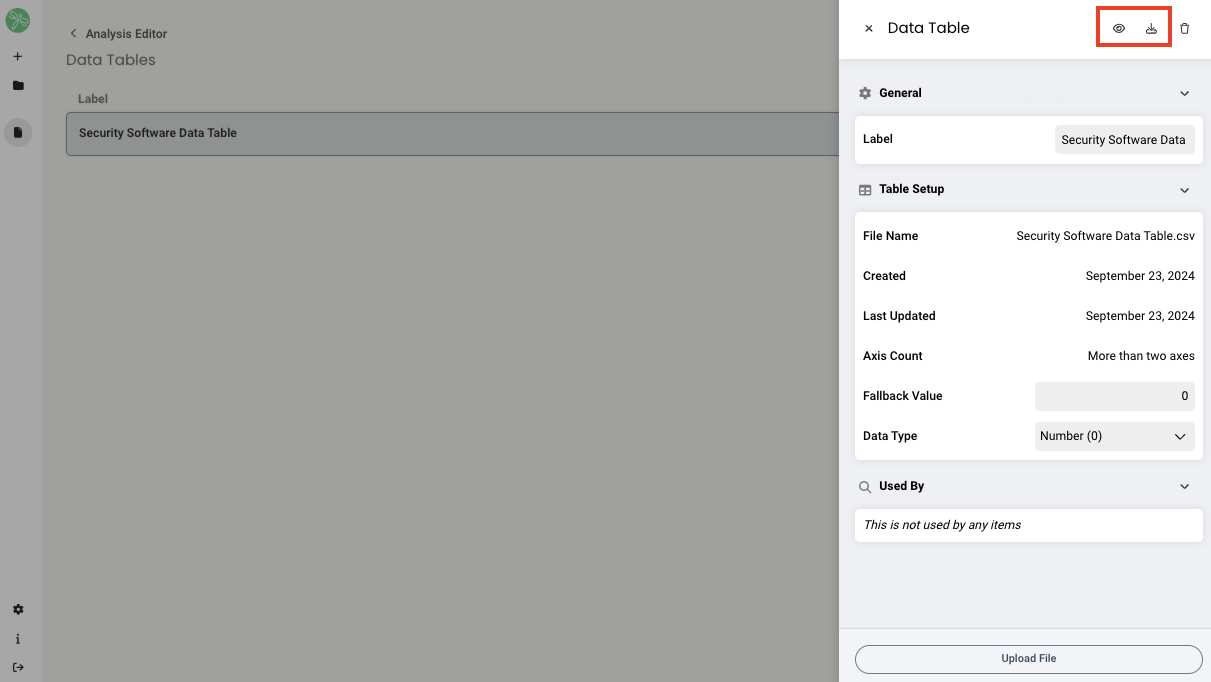
Once a data table is uploaded into the system, you have the option to view the data onscreen, or download the original spreadsheet. This allows you to easily review the data, check for errors, and download to make any necessary changes. You can find both of these options in the side panel once you select a data table from the list.
If you choose to view the data. here is what you can see.
Troubleshooting tips
- If you are not getting the expected values in your global variable fields, make sure the variables are tied to the right dropdowns (selects). For example, if you have a multi-axis data table, the final global variable field that inherits the final output should be connected to the most downstream Select.
Replies have been locked on this page!