
Usage Reports allows users with to access Content Management or Airship to generate usage reports that can focus on specific categories for in-debt analysis.
Accessing Usage Reports
In order to access Usage Reports, the user has to have the View Reports privilege. To add this privilege, read the Creating user groups and assigning permissions documentation. Once the privilege is added, the option for Usage Reports will appear.
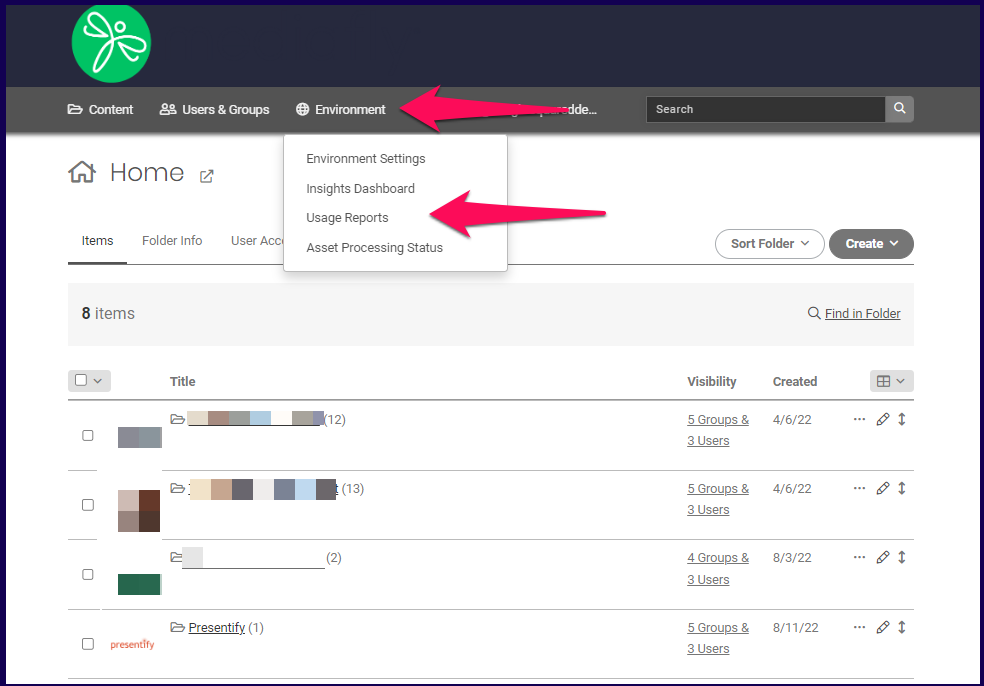
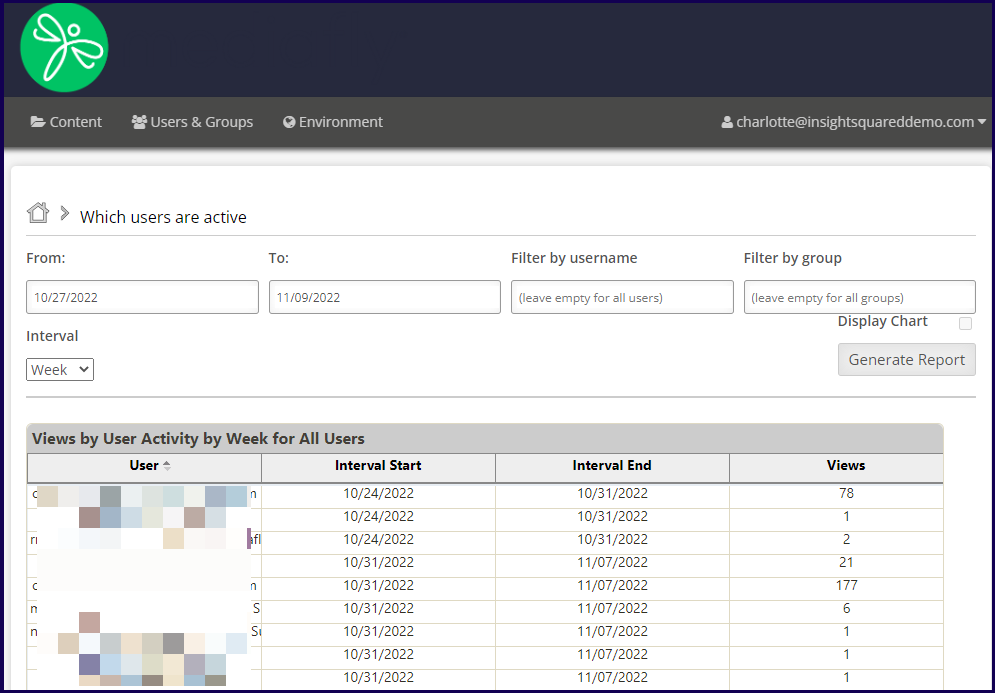
In the Content Management page, click on Environment and select Usage Reports.
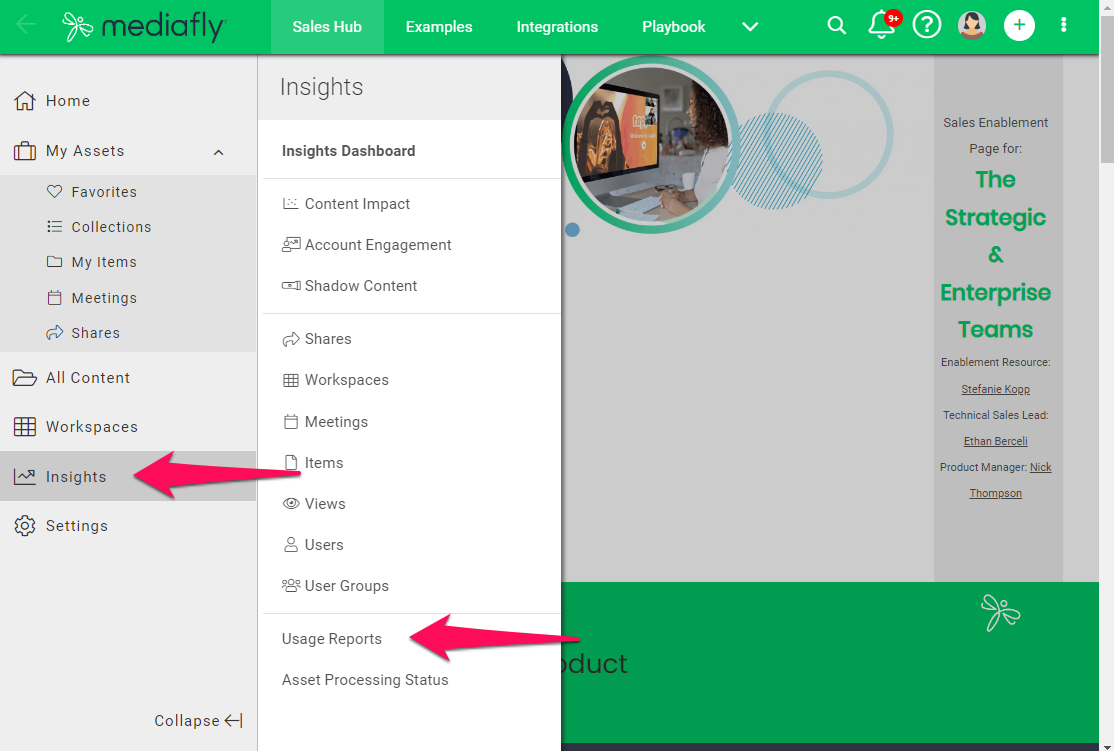
Note: Depending on the environment settings and the granted privilege of the account, you may access usage reports directly in Viewer by selecting Insights and clicking Usage Reports in the Insights column.
The Usage Reports page is displayed. Click on the specific report you want to generate.
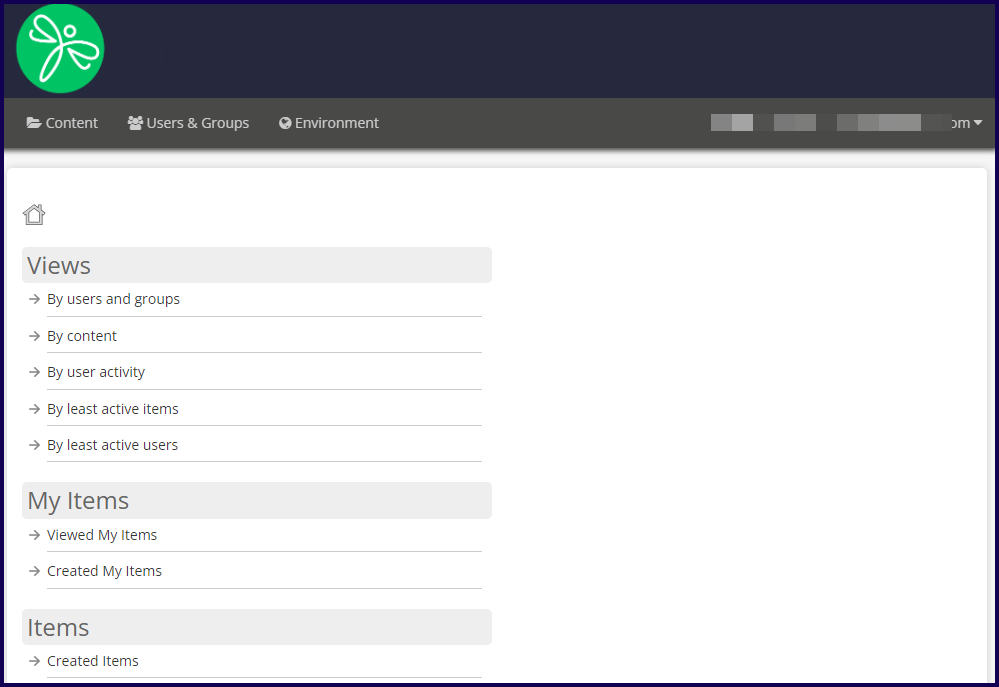
Usage Report Types
Below are the following reports you can choose to create.
Generates reports of all view activities. Users may generate view activity according the following perimeters:
Generates reports of items added to My Items.
Generates reports of all Items inside the environment.
Generates reports on the searches and what folders was accessed.
Generates reports of all views sorted by city, region, and country
Generates reports on what devices was used to access the Mediafly environment.
Views
Usage Reports provides users a way to analyze all view activities inside the environment. This allows content managers to track the number of views, the items being viewed, and the activity of all users.
Generating usage reports to analyze all views made in the environment can be filtered to narrow out the view activities. Users may narrow down their search using date ranges, searching for the view activities of users or groups, or check the view analytics of certain items and folders.
Note: In order to access Usage Reports, the user has to have the View Reports privilege. To add this privilege, read the Creating user groups and assigning permissions documentation. Once the privilege is added, the option for Usage Reports will appear.

The view usage reports allows users to create reports of the views based on the following parameters:
Views by Users and Groups
This report generates view reports by Users and Groups generates the viewing activities of users, or users in a group. Filters may be applied to narrow down the search to see the view stats of within a certain time period, a specified user or group, folder locations and/or items. The Display Chart flag can be marked to create a graph of the generated report.
Note: The display chart is only displayed if the date range is less than 30 days.
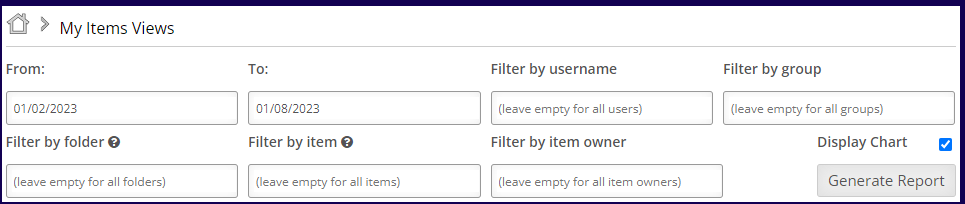
Once the filters have been defined, click on the Generate Report button to create a report.
The report displays the following information:
- User
- Device used to access
- Folder accessed
- Item accessed
- Date accessed
- Maximum time spent viewing an item or collection, and;
- Last page number accessed
Views by Content
Views by Content list the number of views an item has. Filters may be applied to narrow down the search to see the view stats of within a certain time period, folder locations and/or items. The Display Chart flag can be marked to create a graph of the generated report.
Note: The display chart is only displayed if the date range is less than 30 days.
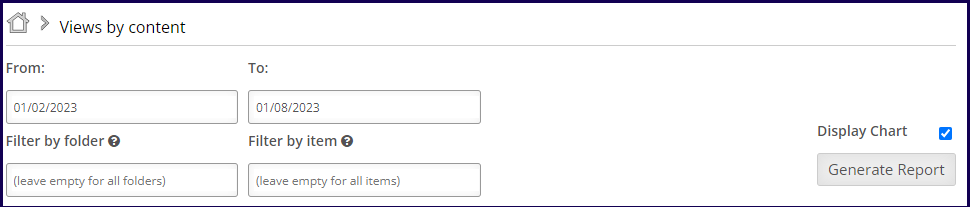
Once the filters have been defined, click on the Generate Report button to create a report.
The report displays the following information:
- Folder
- Item viewed
- Number of views
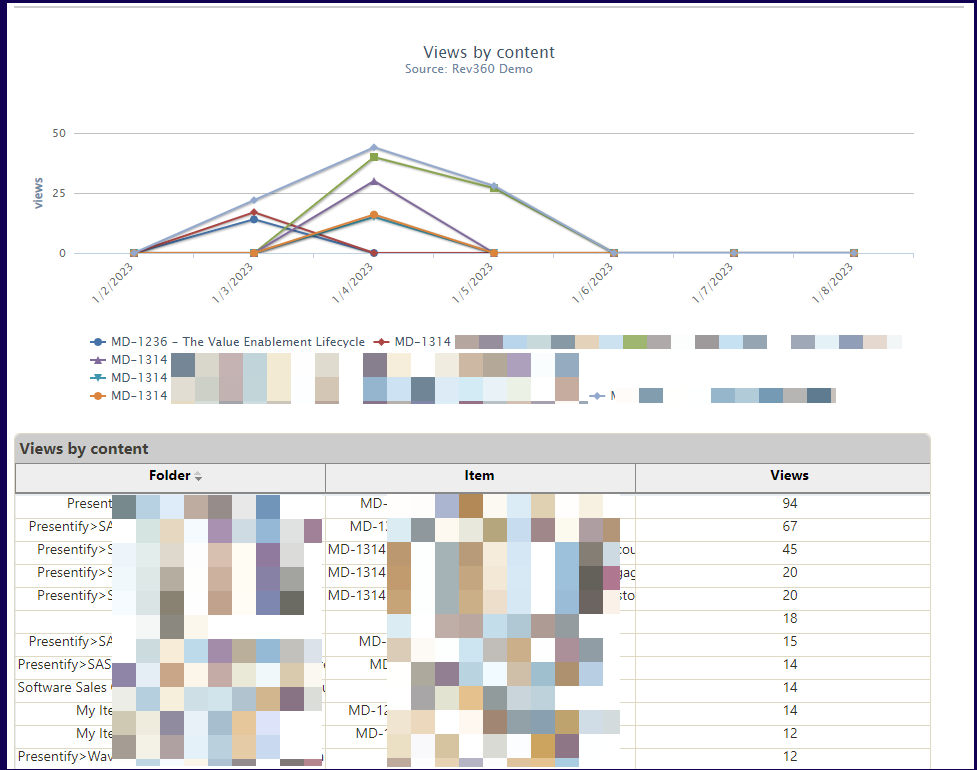
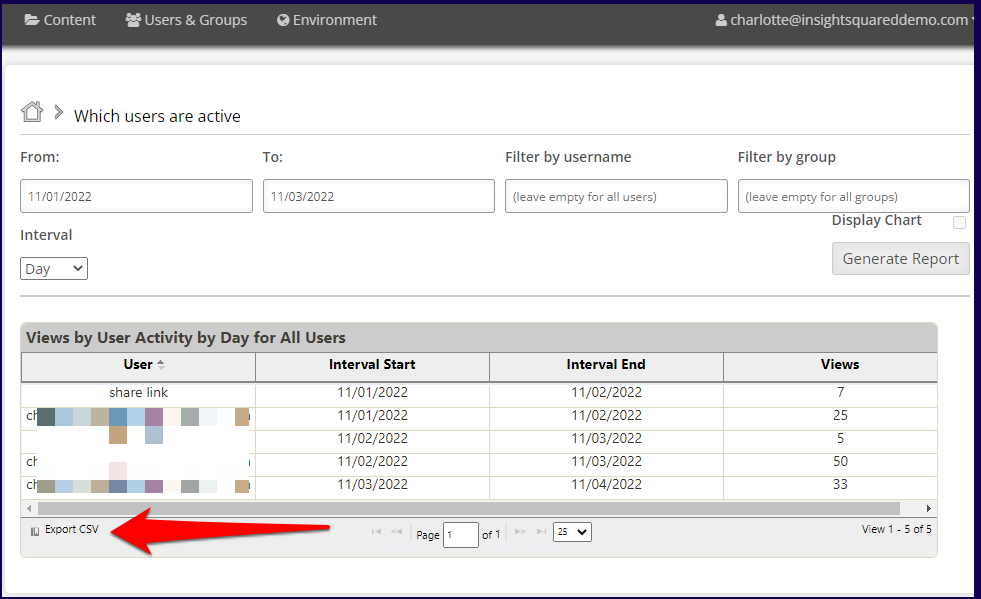
Views by User Activity
Views by User Activity list the number of views users made over a certain interval. Filters may be applied to narrow down the search to see the view stats of within a certain time period, a specified user or group, folder locations and/or items. You may set to check the view intervals by days, weeks, months or years.
The Display Chart flag cannot be marked as this report cannot create a display chart.
The report displays the following information:
- User
- Interval start date
- Interval end date
- Number of views
Once the filters have been defined, click on the Generate Report button to create a report.
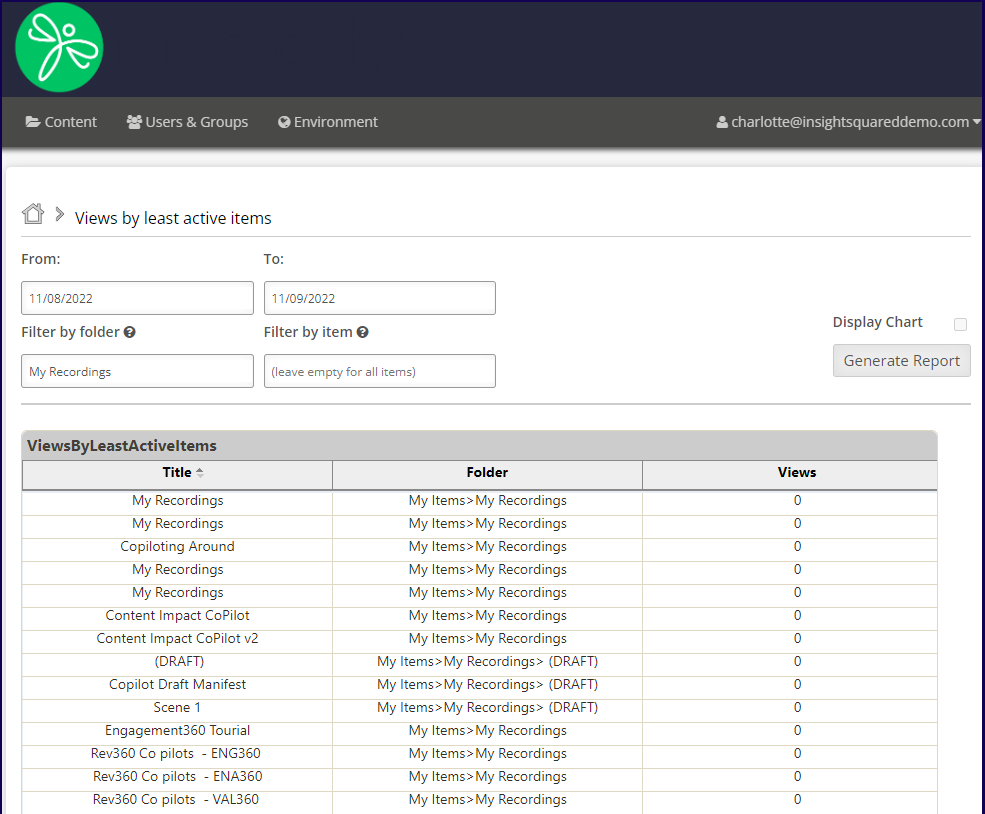
Views by Least Active Items
Views by Least Active Items list the number of views of items and is sorted by the least amount of views of all items in the environment. Filters may be applied to narrow down the search to see the view stats within a certain time period, folder locations and/or items.
The Display Chart flag cannot be marked as this report cannot create a display chart.
The report displays the following information:
- Title of item
- Folder
- Views
Once the filters have been defined, click on the Generate Report button to create a report.
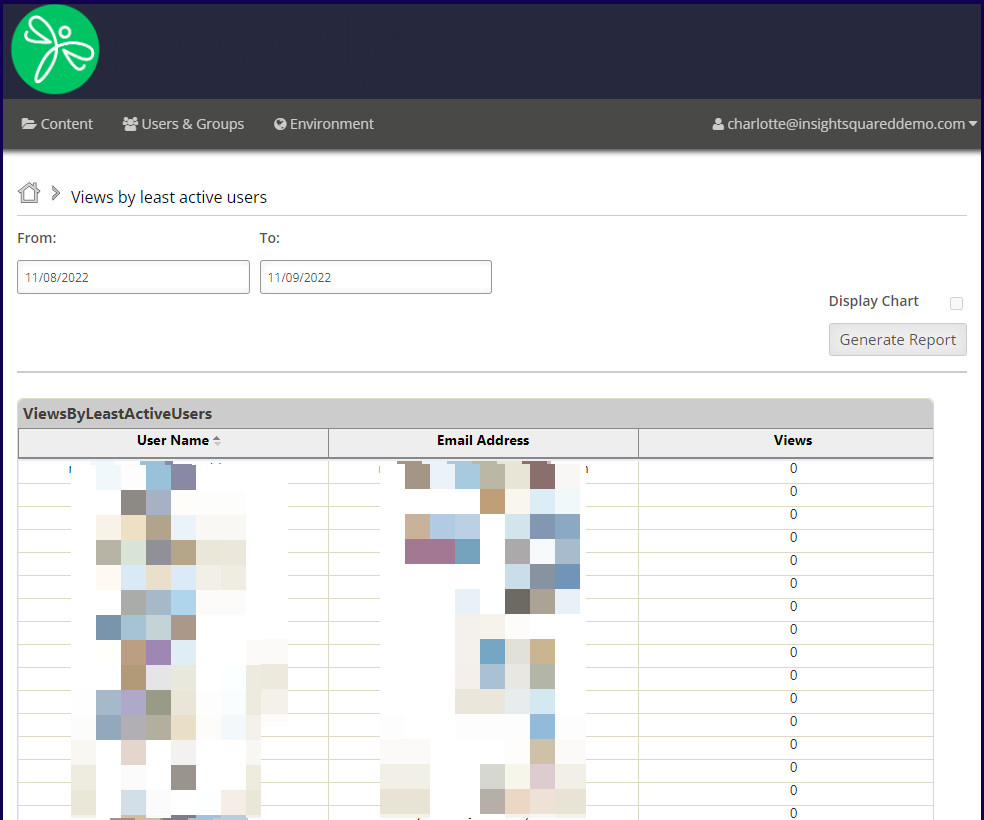
Views by Least Active Users
Views by Least Active users list the number of views the least active users has done on the environment over a set amount of time.
The Display Chart flag cannot be marked as this report cannot create a display chart.
The report displays the following information:
- User name
- Folder
- Views
Once the filters have been defined, click on the Generate Report button to create a report.
Note: Each report may be exported as a CSV file and downloaded. To export the report, click on the Export CSV bottom at the bottom left portion of the generated report.
Items
Usage Reports provides users a way to analyze all views logged for all items created or shared by the content manager generating the report.
Generating usage reports to analyze all items created or shared by the content manager can be filtered to narrow out the view activities. Users may narrow down their search using date ranges, searching for the view activities of users or groups, or check the view analytics of certain items and folders.
Note: In order to access Usage Reports, the user has to have the View Reports privilege. To add this privilege, read the Creating user groups and assigning permissions documentation. Once the privilege is added, the option for Usage Reports will appear.
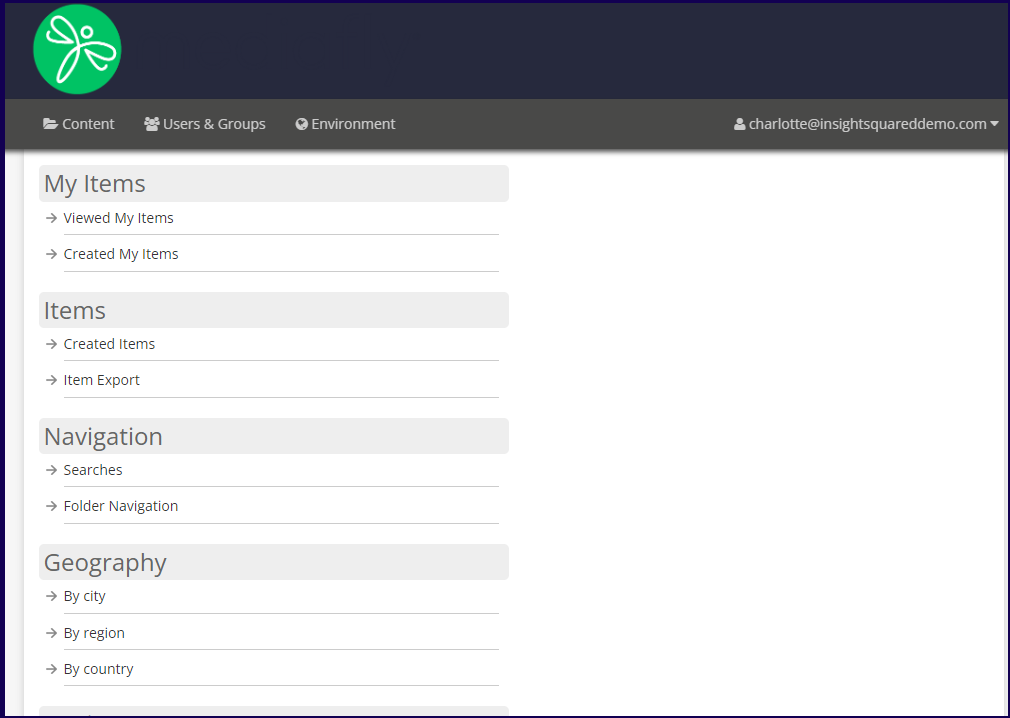
The view usage reports allows users to create reports of the items views based on the following parameters:
- My Items
- Items
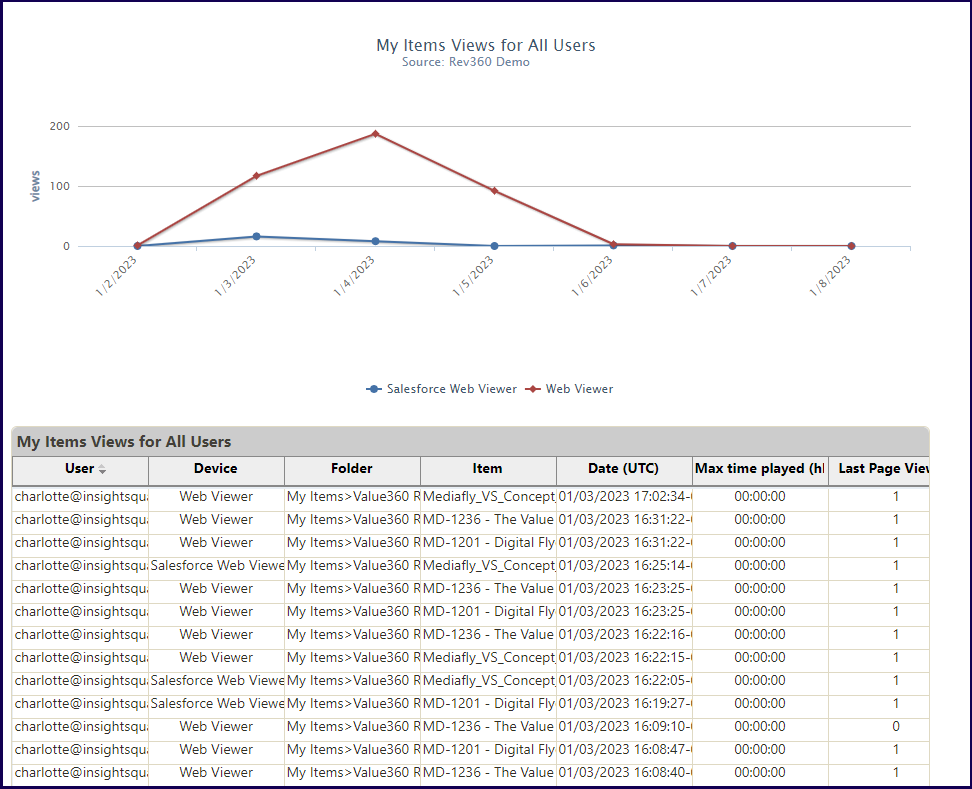
Views made on My Items
This report generates view reports on all items found in the My Items folder. Filters may be applied to narrow down the search to see the view stats within a certain time period, a specified user or group, folder locations and/or items.
The Display Chart flag can be marked to create a graph of the generated report.
Note: The display chart is only displayed if the date range is less than 30 days.
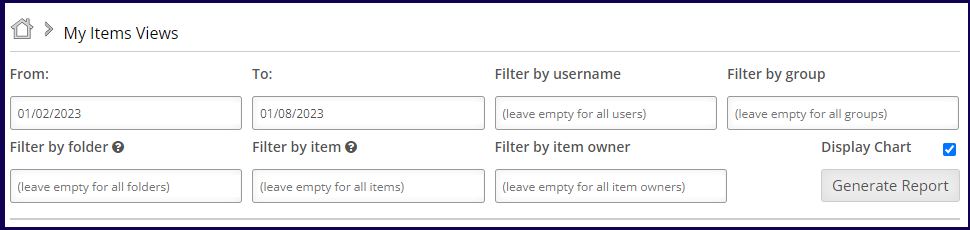
Once the filters have been defined, click on the Generate Report button to create a report.
The report displays the following information:
- User
- Device used to access
- Folder accessed
- Item accessed
- Date accessed
- Maximum time spent viewing an item or collection, and;
- Last page Viewed (Last page number accessed)
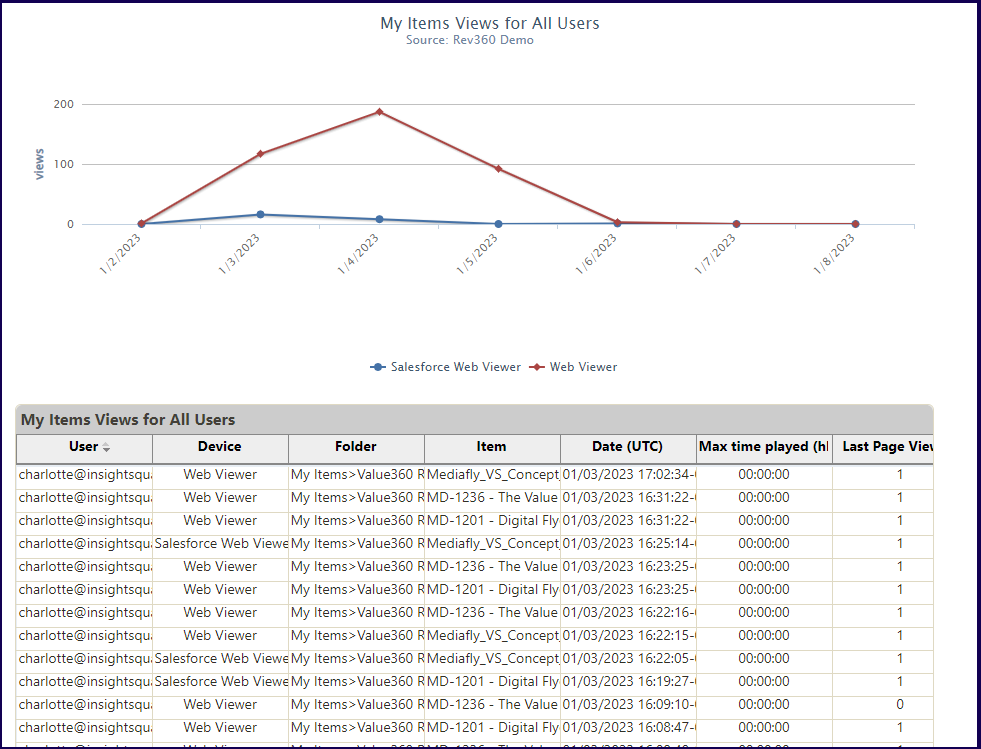
In the above example, a filter has been set on the dates and all item views on the indicated dates is displayed.
Views made on Created My Items
This report generates view reports on all created items of the logged user. Filters may be applied to narrow down the search to see the view stats within a certain time period, a specified user or group, item owner, folder locations and/or items.
The Display Chart flag can be marked to create a graph of the generated report.
Note: The display chart is only displayed if the date range is less than 30 days.
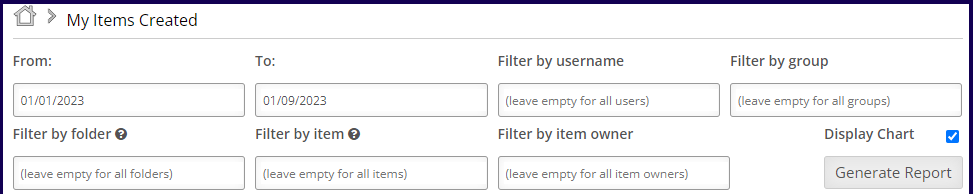
Once the filters have been defined, click on the Generate Report button to create a report.
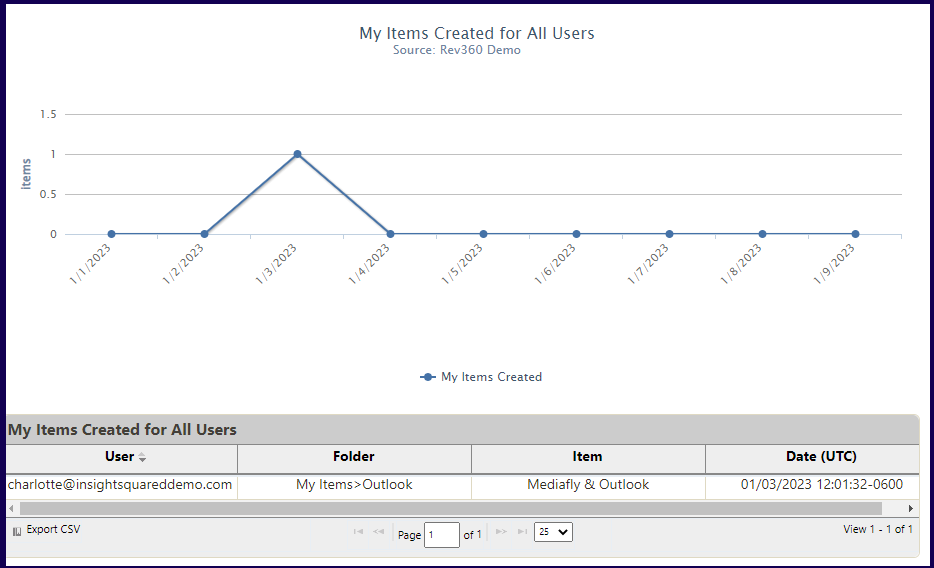
The report displays the following information:
- User
- Folder accessed
- Item accessed
- Date accessed
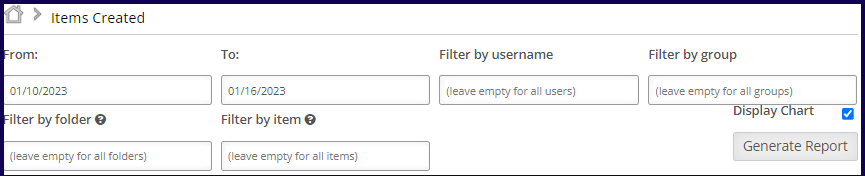
Views made on Created Items for All Users
This report generates view reports on all created items by all users in the environment. Filters may be applied to narrow down the search to see the view stats within a certain time period, a specified user or group, folder locations and/or items.
The Display Chart flag can be marked to create a graph of the generated report.
Note: The display chart is only displayed if the date range is less than 30 days.
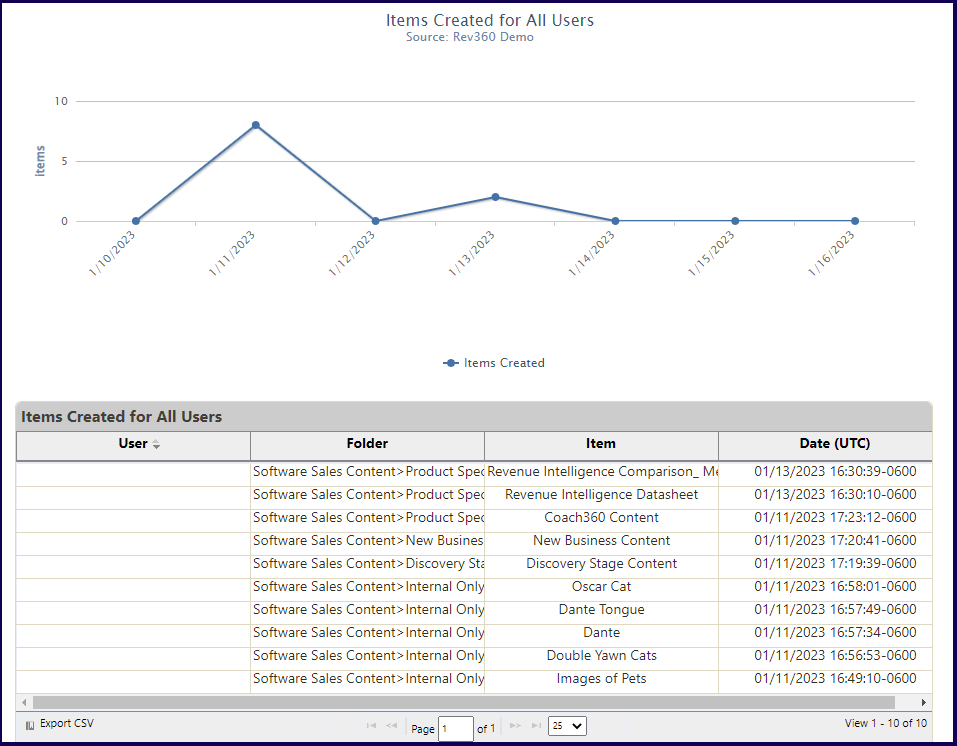
The report displays the following information:
- User
- Folder accessed
- Item accessed
- Date accessed
Item Export
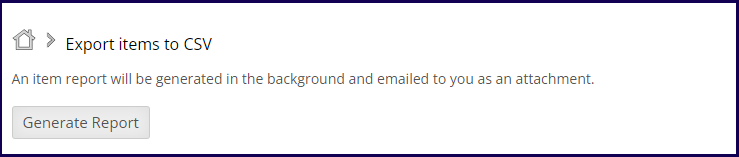
This report is used to generate an item report of all items in the environment. The item report is sent as an email to the registered account of the logged user.
To create a report, click on the Generate Report button.
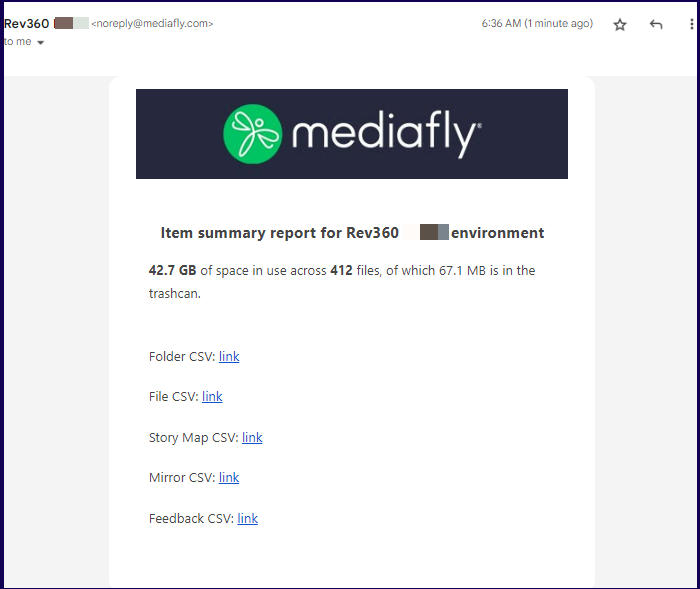
Once click, a message is displayed informing you that the report is being generated. An email is sent to your email address.
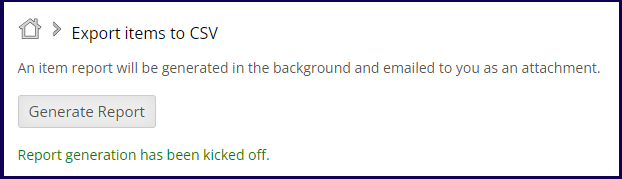
The email of the item summary is sent to your email. Click on the respective CSV file to view the reports or each category.
Navigation
Usage Reports provides users a way to analyze the navigation of users in the environment. This allows you to identify which are the most often visited files and the searches made within the environment.
Generating usage reports to analyze the navigation and search made in the environment can be filtered to narrow out. Users may narrow down their search using date ranges, usernames, and folders.
Note: In order to access Usage Reports, the user has to have the View Reports privilege. To add this privilege, read the Creating user groups and assigning permissions documentation. Once the privilege is added, the option for Usage Reports will appear.
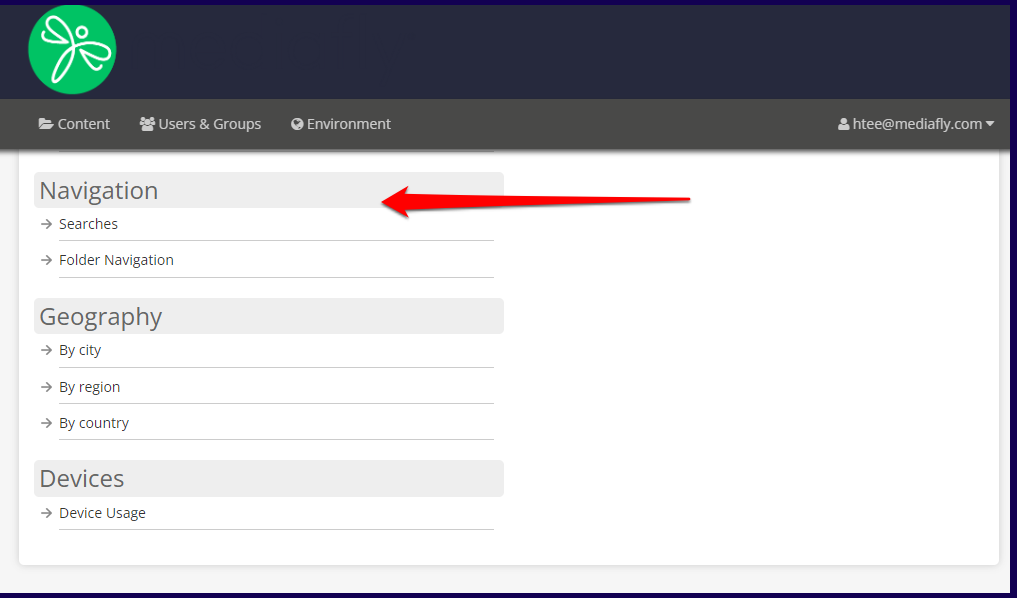
The view navigation reports allows users to create reports based on the following parameters:
- Searches
- Folder Navigation
Searches
This report presents all the searches that users used in the environment. This allows you to get an idea of what the users are often searching for and can optimize the site accordingly. Filters may be applied to narrow down the search within a certain time period or a specific user.
The Display Chart flag can be marked to create a graph of the generated report.
Note: The display chart is only displayed if the date range is less than 30 days.
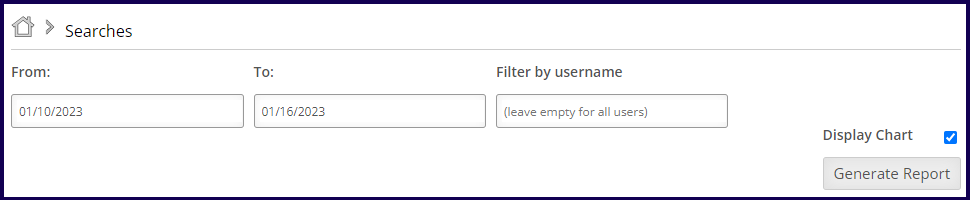
Once the filters have been defined, click on the Generate Report button to create a report.
The report displays the following information:
- Device
- Search Term
- Searches
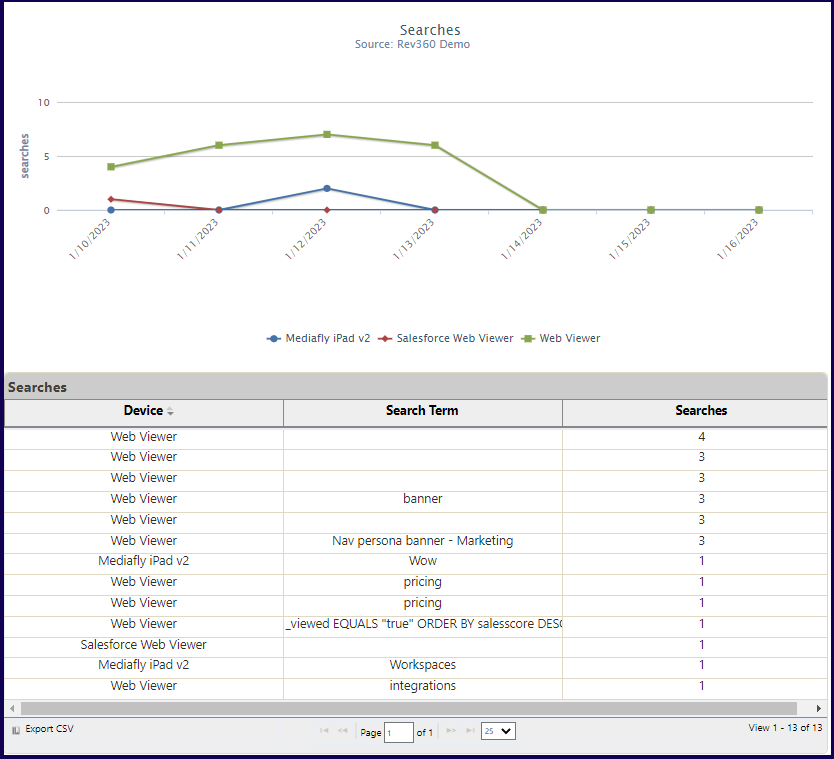
In the above example, a filter has been set on the dates and all item views on the indicated dates is displayed.
Folder Navigation
This report is used to view the folders that all users in the environment have accessed. By knowing which sites are often accessed and viewed, you can highlight or optimize these places in your workspace for easier access and to improve access experience of the end users.
Filters may be applied to narrow down the search within a certain time period or a specific folder.
The Display Chart flag can be marked to create a graph of the generated report.
Note: The display chart is only displayed if the date range is less than 30 days.
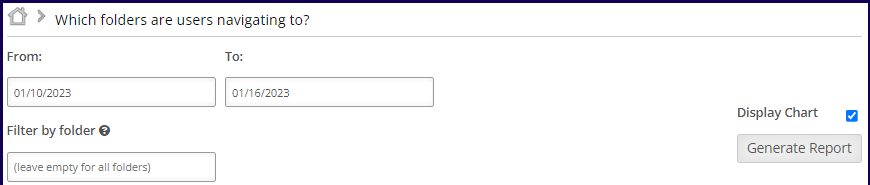
Once the filters have been defined, click on the Generate Report button to create a report.
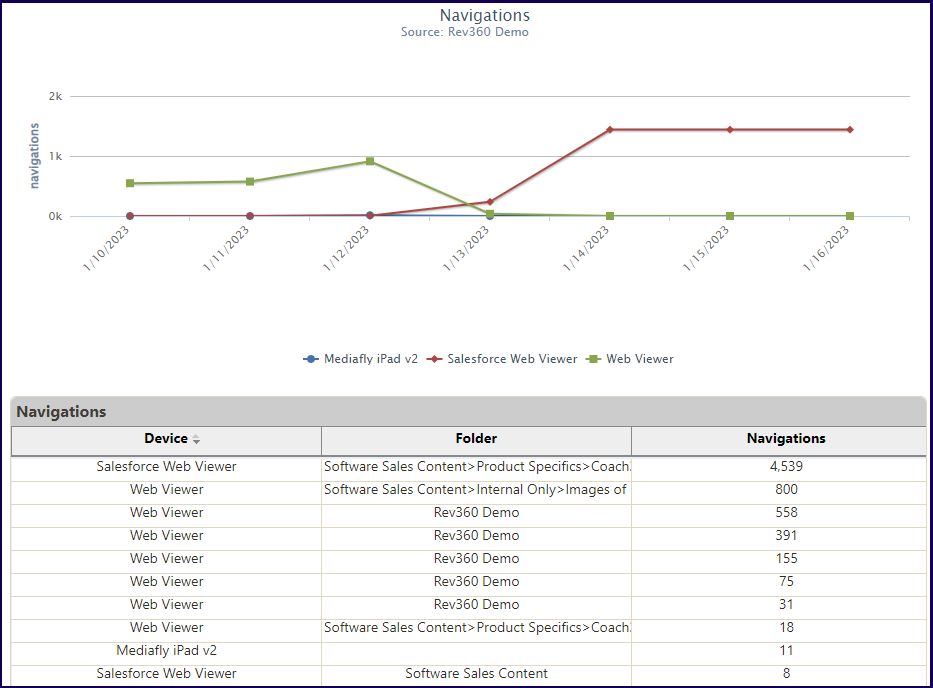
The report displays the following information:
- Device
- Folder
- Navigations
Geography
Usage Reports provides users a way to analyze the physical location of all users in the environment. This allows you to identify where you users are based and create relevant content to boost interactions of users through relevant and relatable contents, designs, news, or activities.
Generating usage reports to analyze the navigation and search made in the environment can be filtered to narrow out. Users may narrow down their search using date ranges, usernames, groups, folders, and the item viewed.
Note: In order to access Usage Reports, the user has to have the View Reports privilege. To add this privilege, read the Creating user groups and assigning permissions documentation. Once the privilege is added, the option for Usage Reports will appear.
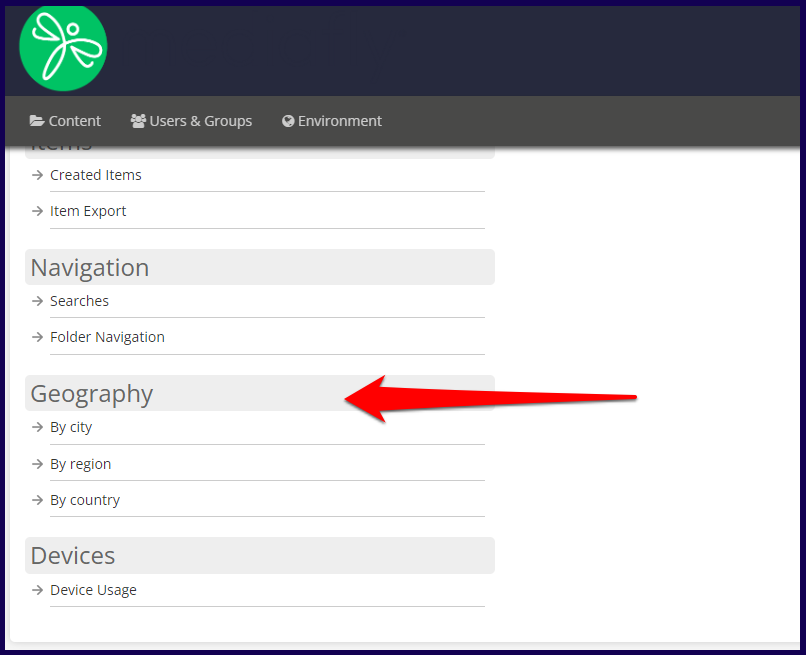
The geography reports allows users to create reports based on the following parameters:
- By city
- By region
- By country
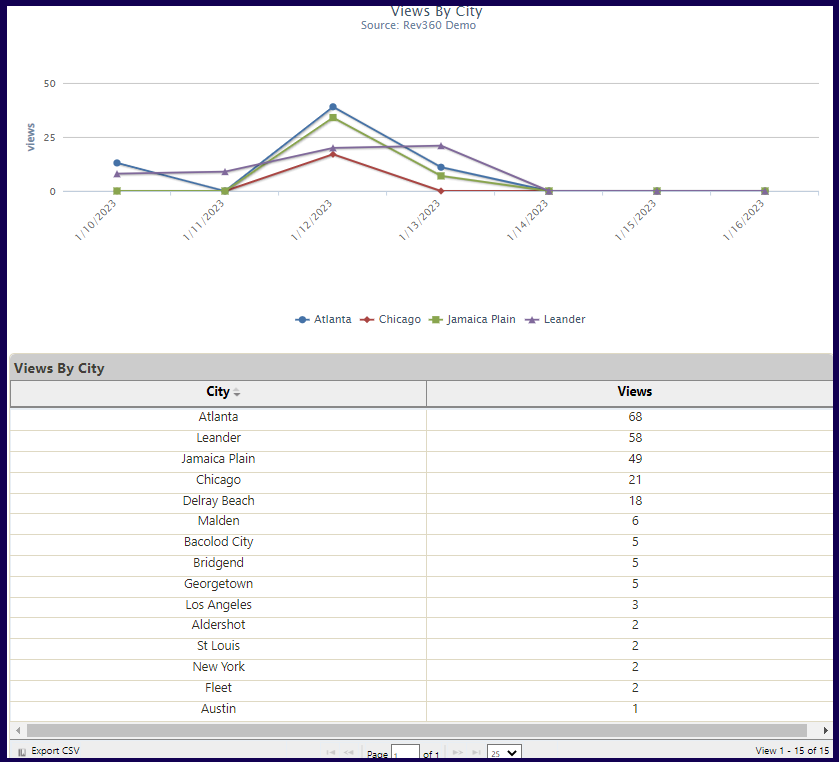
By City
This reports displays the city where all the users are from.
Filters may be applied to narrow down the search to a certain time period, a specified user or group, or the folder locations and/or items to pull up the city data.
The Display Chart flag can be marked to create a graph of the generated report.
Note: The display chart is only displayed if the date range is less than 30 days.
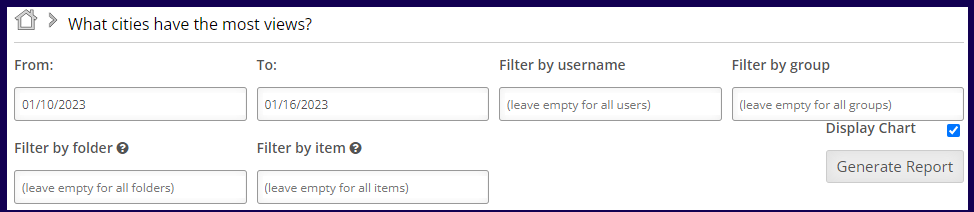
Once the filters have been defined, click on the Generate Report button to create a report.
The report displays the following information:
- City
- Views
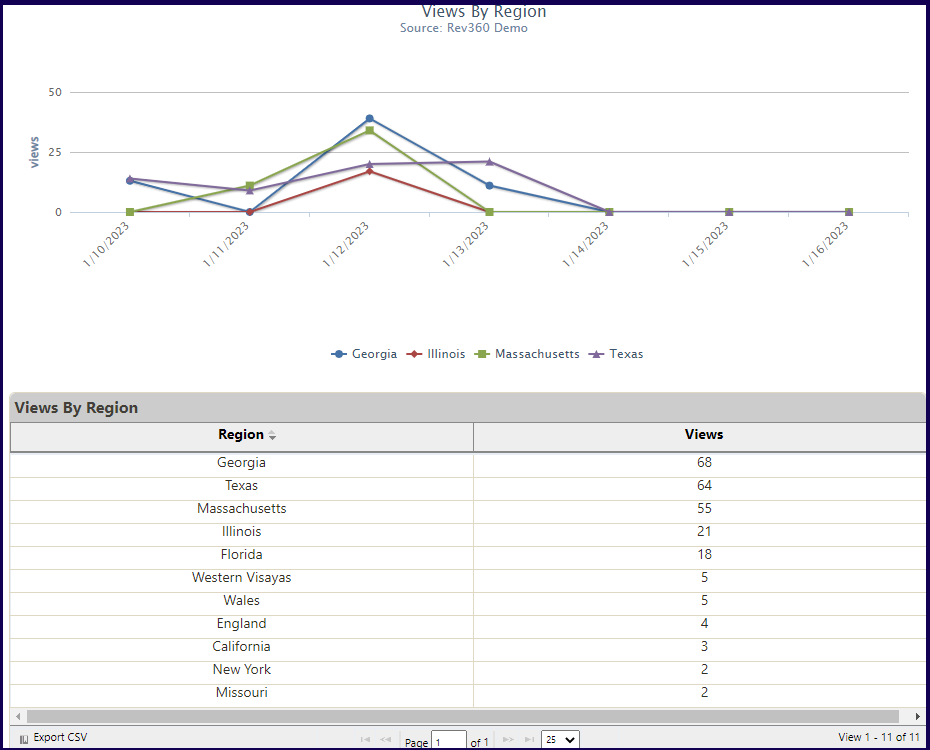
By Region
This reports displays the region where all the users are from.
Filters may be applied to narrow down the search to a certain time period, a specified user or group, or the folder locations and/or items to pull up the city data.
The Display Chart flag can be marked to create a graph of the generated report.
Note: The display chart is only displayed if the date range is less than 30 days.
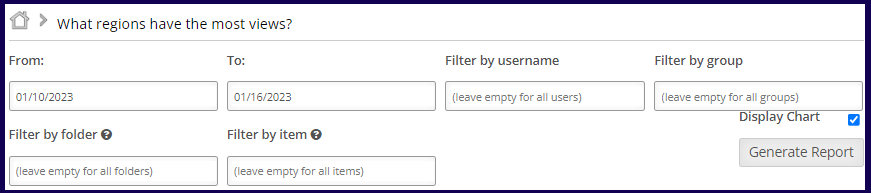
Once the filters have been defined, click on the Generate Report button to create a report.
The report displays the following information:
- Region
- Views
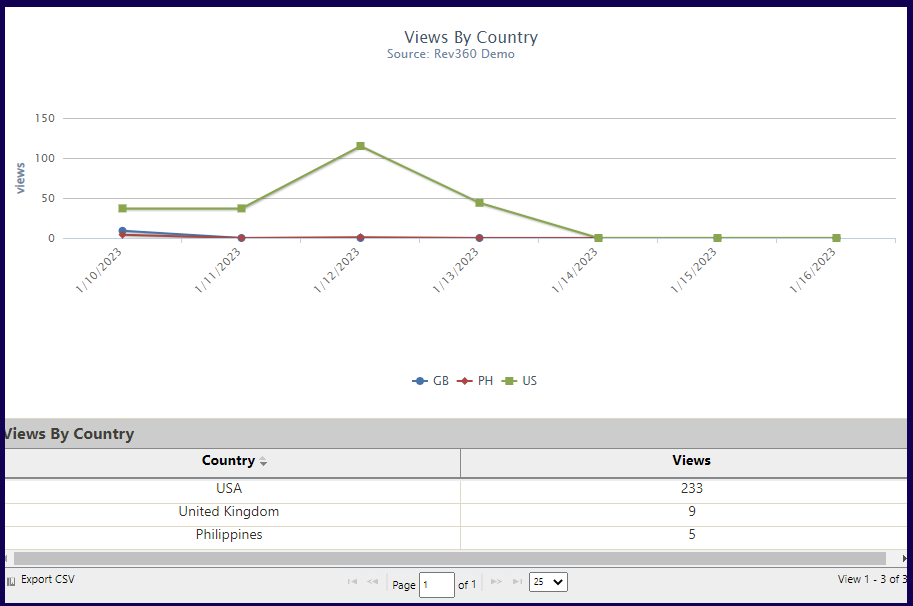
By Country
This reports displays the country where all the users are from.
Filters may be applied to narrow down the search to a certain time period, a specified user or group, or the folder locations and/or items to pull up the city data.
The Display Chart flag can be marked to create a graph of the generated report.
Note: The display chart is only displayed if the date range is less than 30 days.
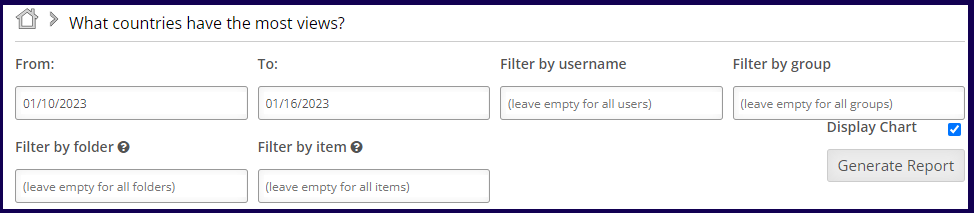
Once the filters have been defined, click on the Generate Report button to create a report.
The report displays the following information:
- Country
- Views
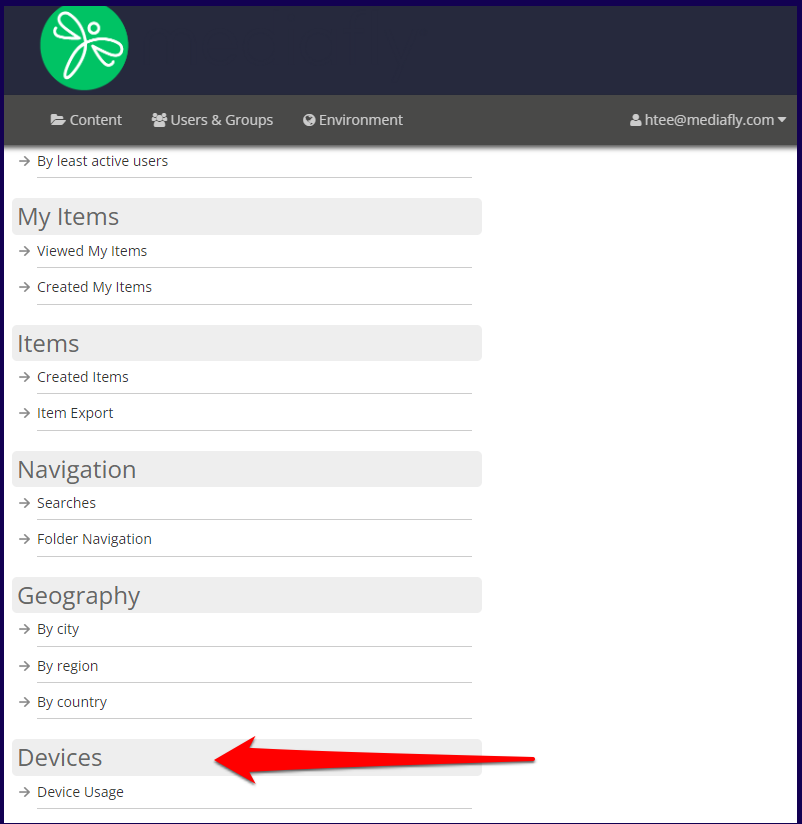
Devices
Usage Reports provides users a way to analyze the devices that of all users who accesses the environment. This allows you to identify the devices that your users use most often and allow you to optimize the devices that are preferred by your customers.
Generating usage reports to analyze the navigation and search made in the environment can be filtered to narrow out. Users may narrow down their search using date ranges, usernames, groups, folders, and the item viewed.
Note: In order to access Usage Reports, the user has to have the View Reports privilege. To add this privilege, read the Creating user groups and assigning permissions documentation. Once the privilege is added, the option for Usage Reports will appear.
Device Usage
This reports displays the city where all the users are from. Filters may be applied to narrow down the search to certain time periods. The Display Chart flag can be marked to create a graph of the generated report.
Note: The display chart is only displayed if the date range is less than 30 days.
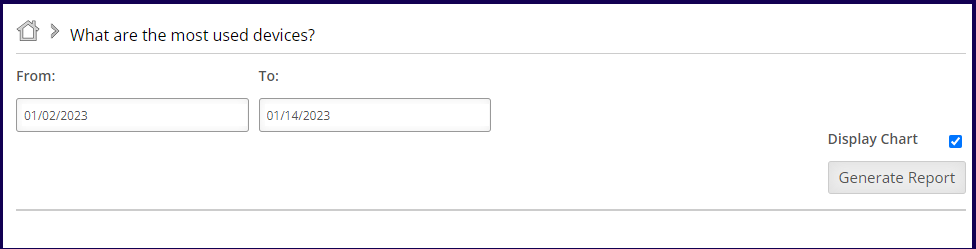
Once the filters have been defined, click on the Generate Report button to create a report.
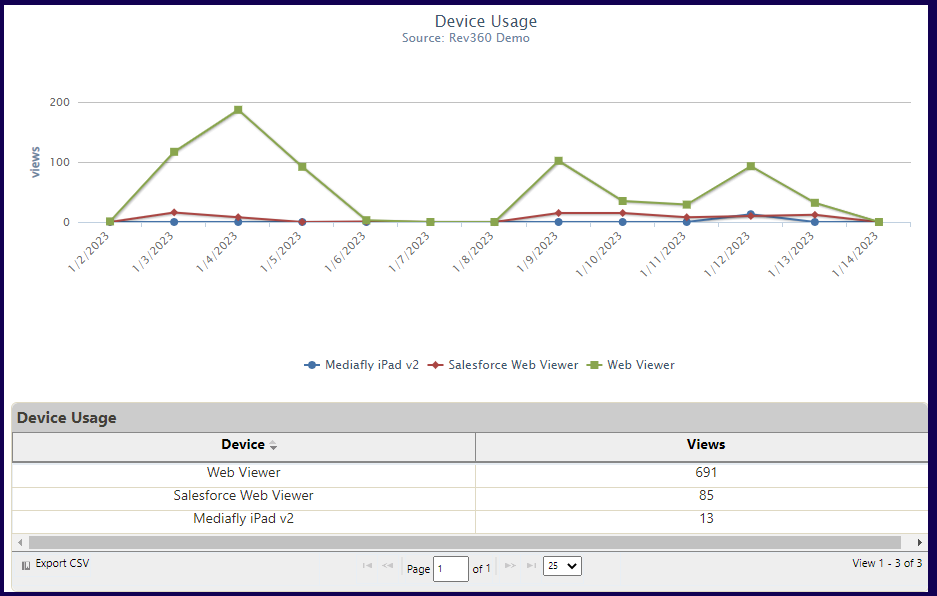
The report displays the following information:
- Device
- Views
If you run into any issues, please contact support.
Replies have been locked on this page!