
The Engagement Insights analytics dashboard is designed to seamlessly extract and present key engagement metrics from all stages of the sales cycle. This comprehensive tool aids in informed decision-making regarding marketing content creation, financial investment, and the enhancement of future sales interactions. By leveraging the dashboard's capabilities, users can gain valuable insights that drive strategic decisions and optimize marketing efforts.
Note: Items or items within parent folders that have selected "Hidden From Search/Content Assistant/Insights/Meetings" will not be populated in Insights.
Keys to success
- Allocate sales content creation budgets more effectively
- Drive better sales and marketing alignment
- Increase CRM usage and adoption by sellers
- Optimize content for improved sales outcomes
Jump to:
- Accessing the Insight Reports
- Using Insights Filters
- Group by Session
- Shares
- Workspaces
- Meetings
- Items
- Users
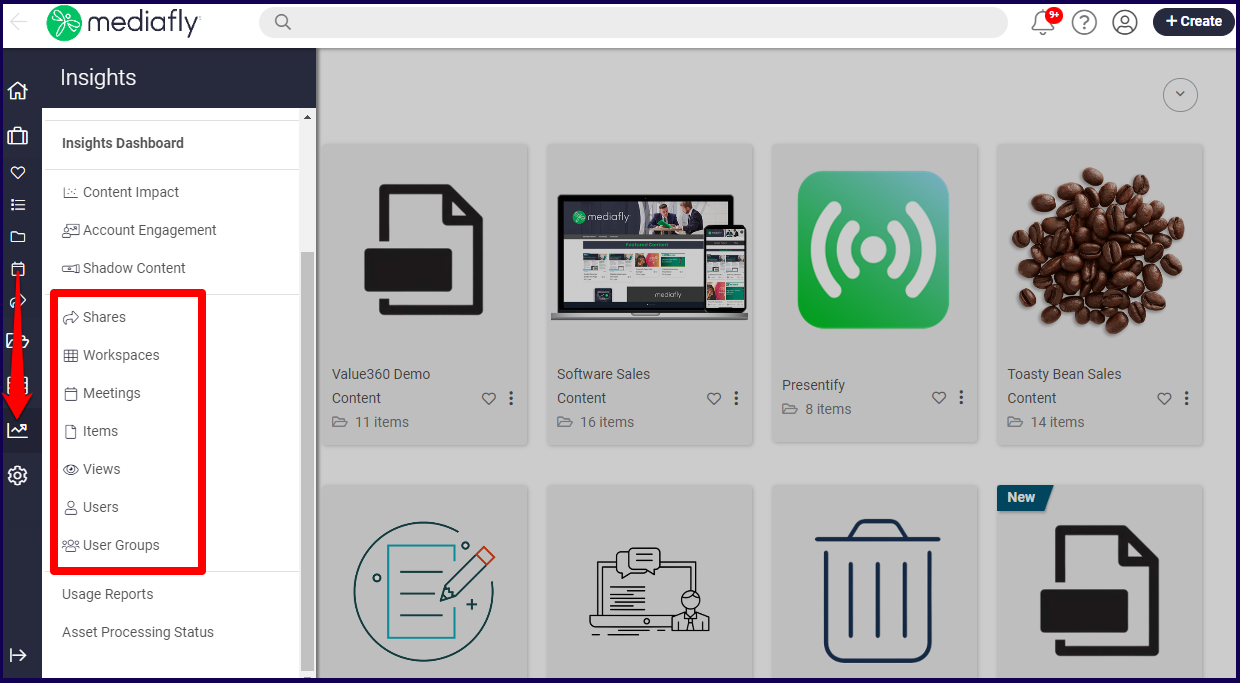
Accessing the Insight Reports
To access the Insight reports, the user must have the View Reports privilege assigned to them.
- Log in to your Engagement Mediafly account and lick on Insights, or the Insights icon, and select the insight report you want to view.
- The selected report is displayed.
Note: If no filters have been defined previously, the system retrieves all data within the last 30 days. If a filter has been defined previously, the system applies the last filter that the user profile has set. Refer to the Using Insights Filters for more information on filters.
Using Insights Filters
Numerous filters can be used on insight reports to filter the data being shown. Each report has unique filters specific to the nature of the insight report.
!!! WARNING !!!
Setting filters in one report applies the same filter on another report. For example, setting the activity date range of the Insight Workspace to 90 days automatically sets the view date range of the Insight Views report to 90 days.
Any reports that uses similar filters will automatically display this filter.
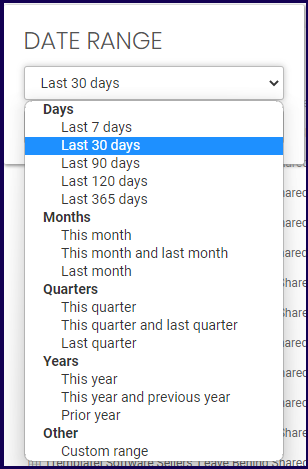
Date Range Filters
The date range is used to select a period of time which displays the number of instance each stat has. Selecting a date range displays the period of which the data of the selected item line is based on.
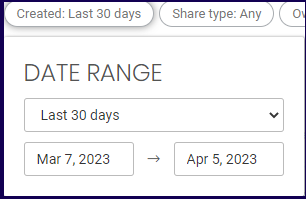
The date range can be set to the following ranges:
User Filters
User filters are used in numerous Insight reports. Each report allows you to filter out users with specific functions depending on the report. For example, in Shares, the filter allows you to filter users who are 'owners' of the shared item. In Items, the user filter is 'Created by user' and 'activity by user'.
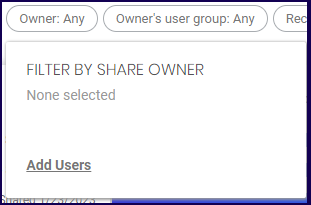
In the example below, the clicking the 'Owner' button allows you to set a user as a filter:
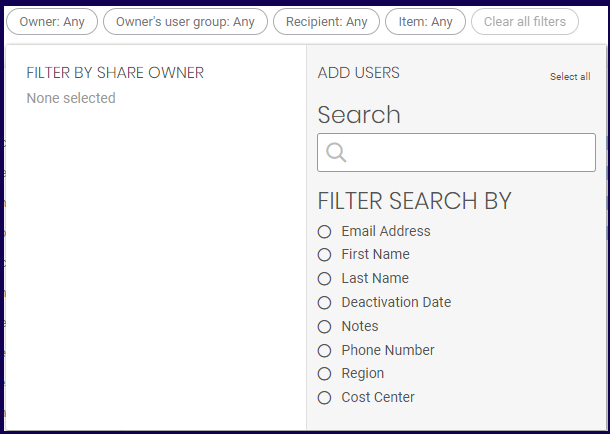
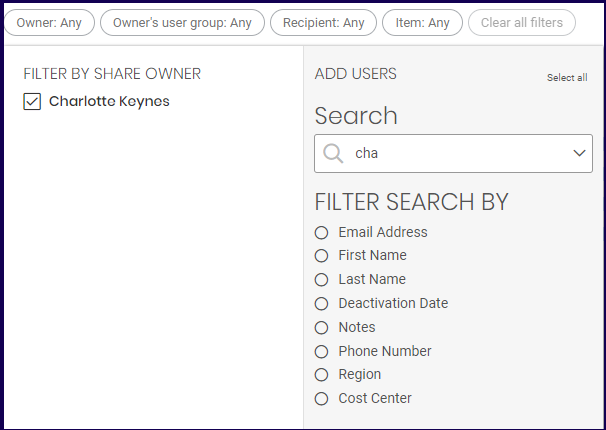
Users may be filtered through various profile details. You can use the search field to search for the name, or any other data of a user.
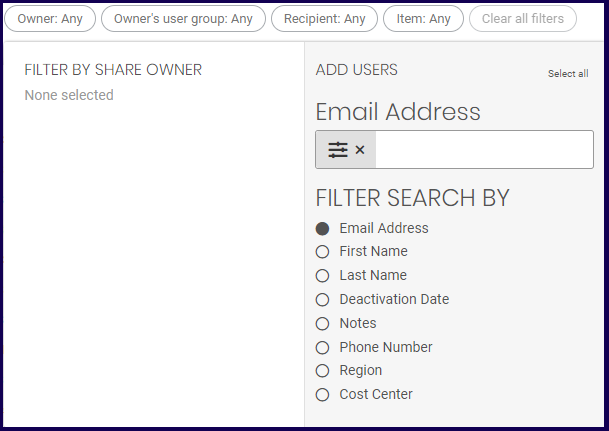
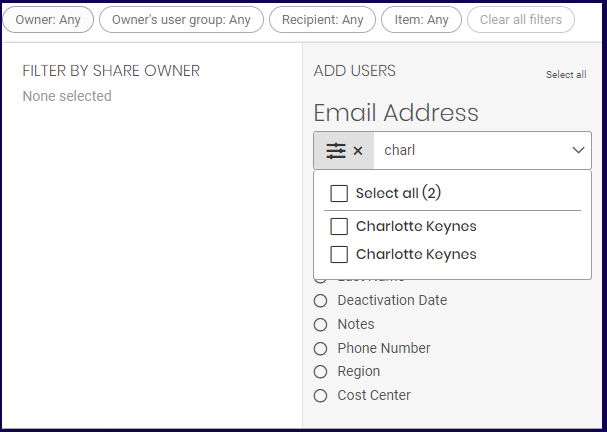
You may also narrow down the matches by marking a specific profile detail. In the example below, the Email Address is selected. Typing the email address of a specific user will filter out the results.
Note: The First Name, Last Name, Notes, and Phone Number offers a similar field. Enter the corresponding information of the user to search for the user.
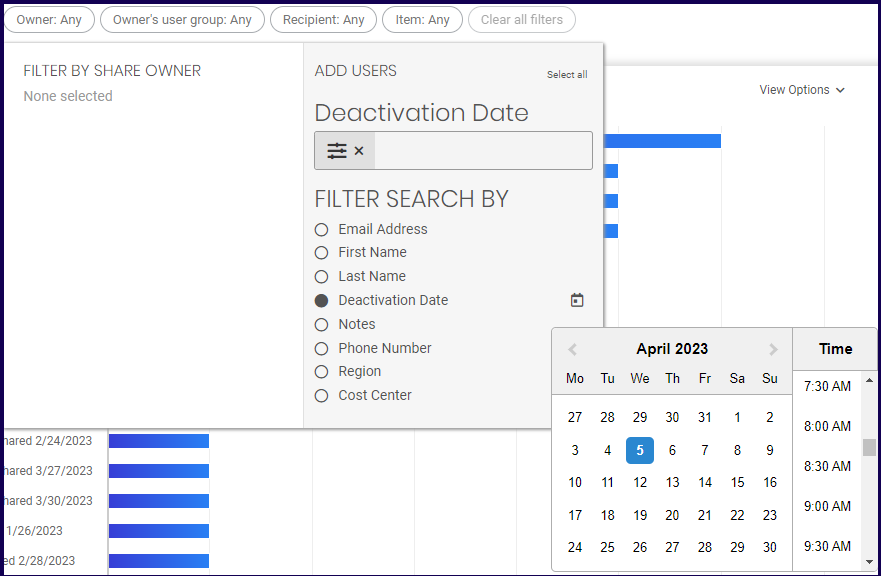
The deactivation date may be used as a filter. Upon marking the field, the date and time field appears. Select the date and time to filter the user.
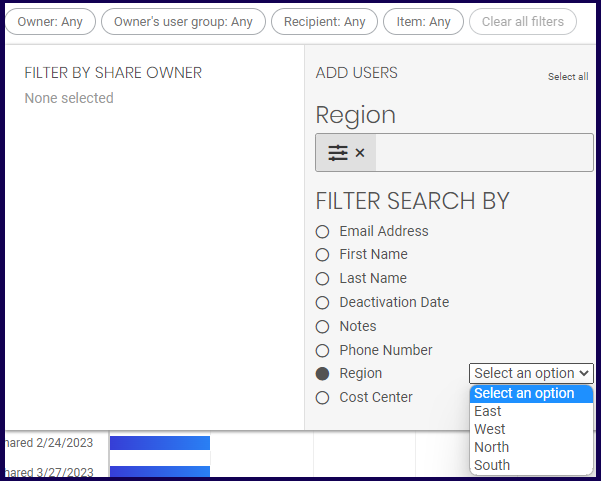
Depending on any custom fields in your environment, other filtering options maybe available, allowing you to select options from a dropdown.
Once a user has been selected, the user is added on the Filter by Share Owner section.
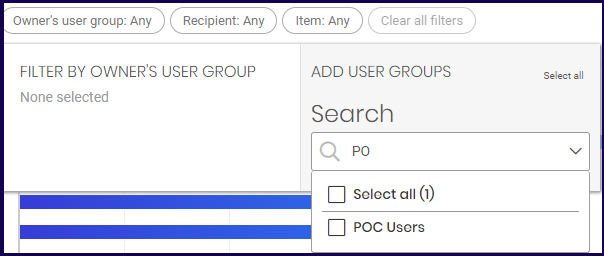
User Group Filter
User group filters are used in numerous Insight reports. Each report allows you to filter out groups depending on the report. For example, in Shares, the filter allows you to filter by the group of the 'owner' of the shared item. In Items, the group filter is 'Created by group'.
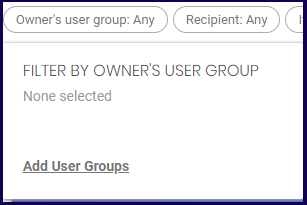
Once selected, the filter by group options is displayed. Select Add User Groups to add a group.
The Add User Groups section is displayed. Use the field to type in the name of the group. Once a value has been specified, the search displays all matches. Mark the group you want to add.
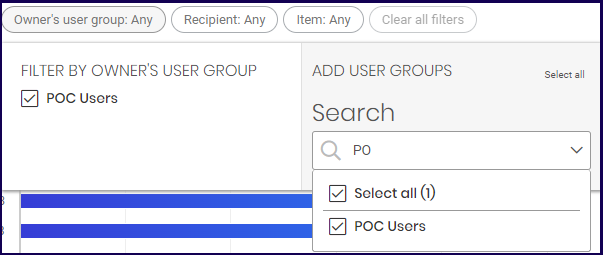
Once the group is marked, the selected user is displayed on the filter by group section.
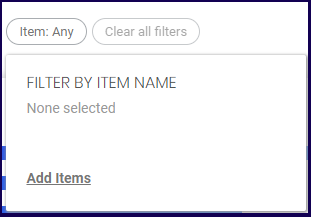
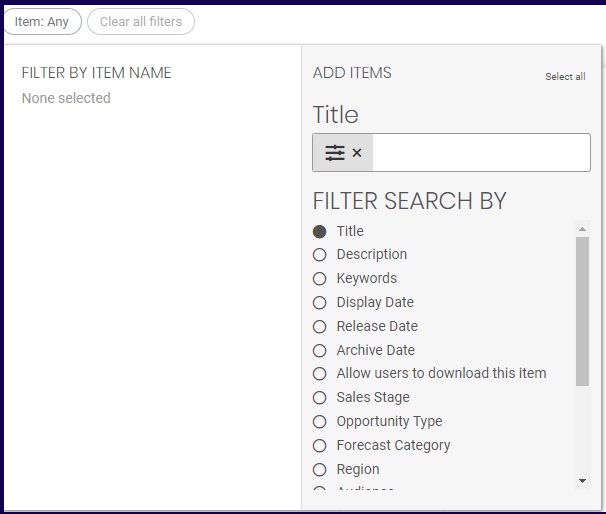
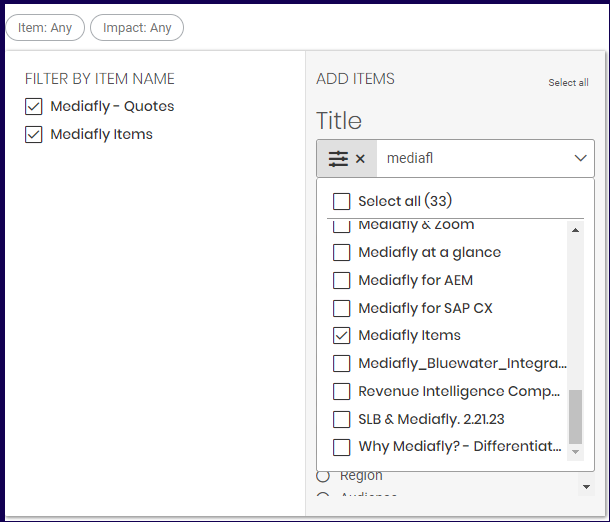
Item Filter
Item filters are used in numerous Insight reports. This allows you to filter the report to show data based on a specific item or items. Once the Item filter is clicked, select the Add items button to add items to filter.
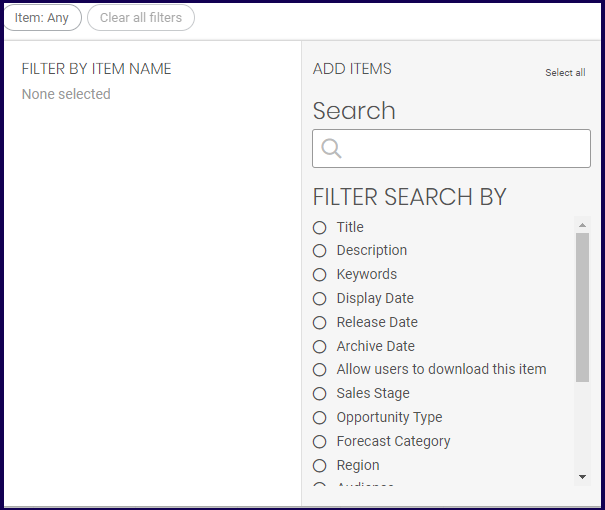
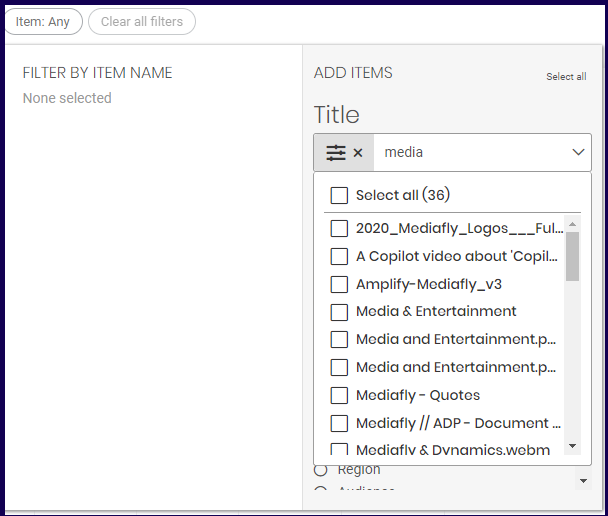
Users may be filtered through various profile details. You can use the search field to search for the item using any data or information of the item.
You may also narrow down the matches by marking a specific profile detail. In the above below, the Title is selected. Typing the title of a specific item will filter out the results.
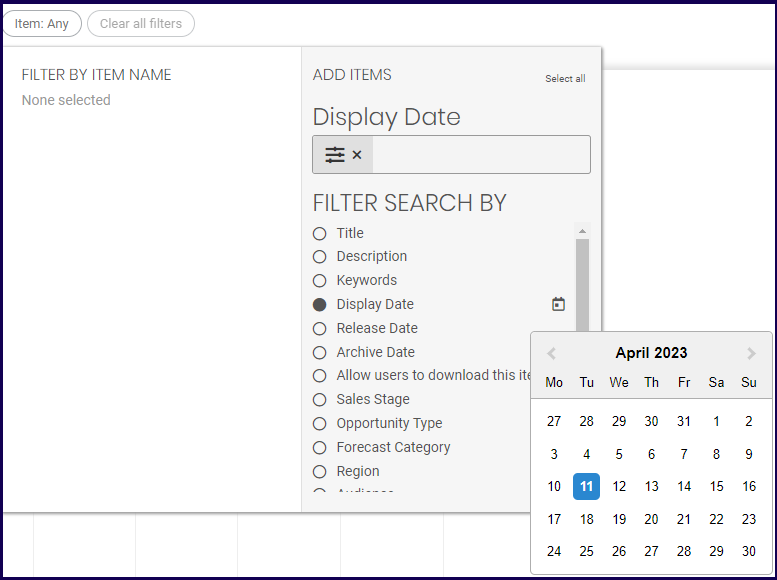
Some fields may be filtered out using dates.
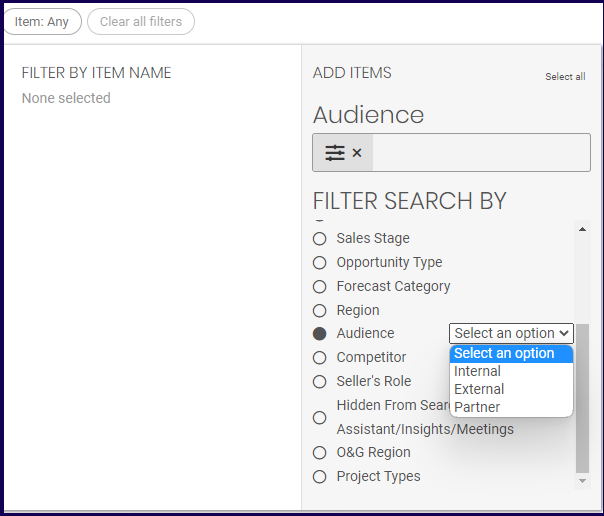
Depending on any fields in your environment, other filtering options maybe available. This allows you to select from a dropdown. In the examples below, filtering by the Audience field allows you to select from three field options.
Once an item has been selected, the item is added on the Filter by Item Name section.
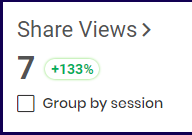
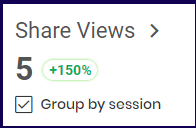
Group by Session
Users may tend to view an item again and again in one session so these views by users within one session might not reflect a true amount of share views. Group by Session allows you to filter out consecutive views tracked within one session of a single user or count all views regardless if the user is viewing it again within one session.
In the example below, the Share Views show different results because some views were made by the same user in one session and were only counted as one view.
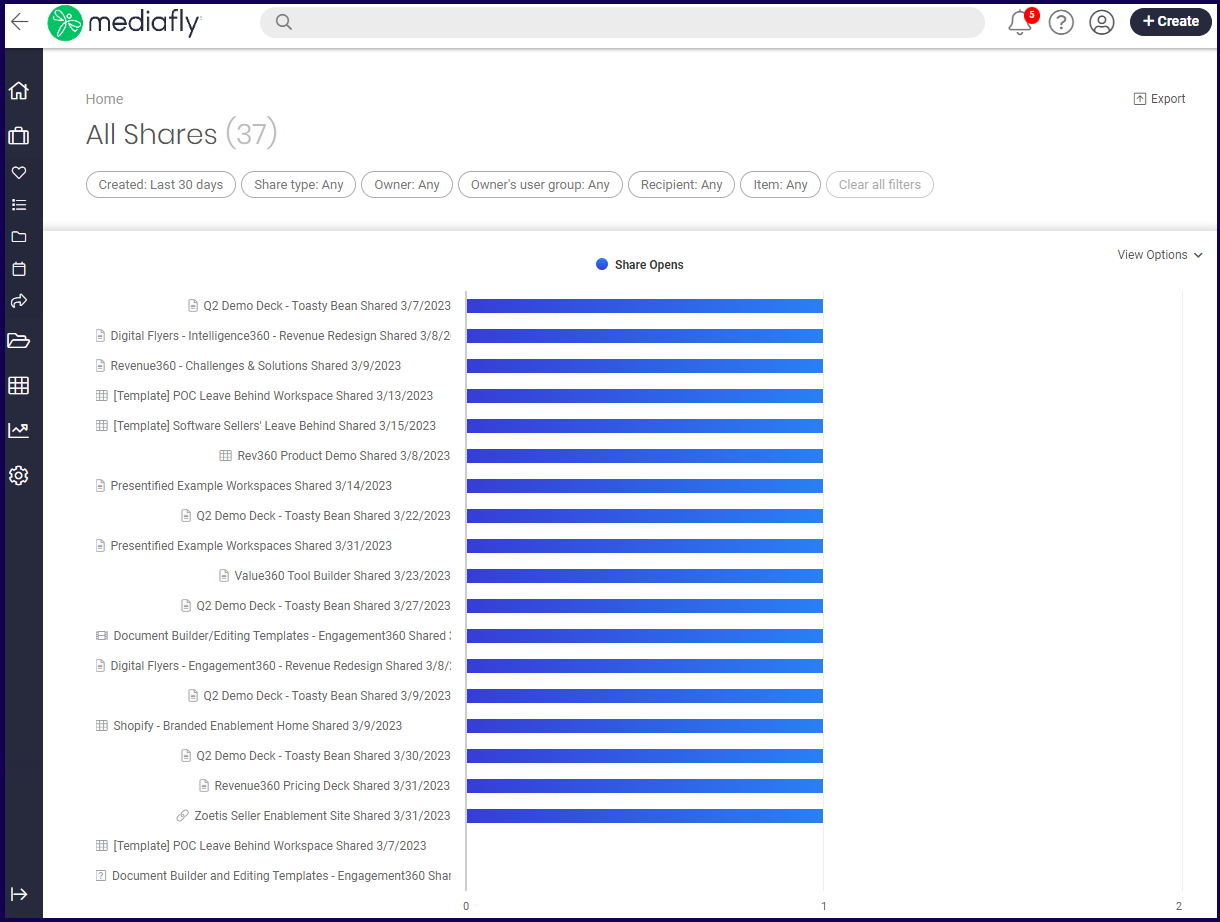
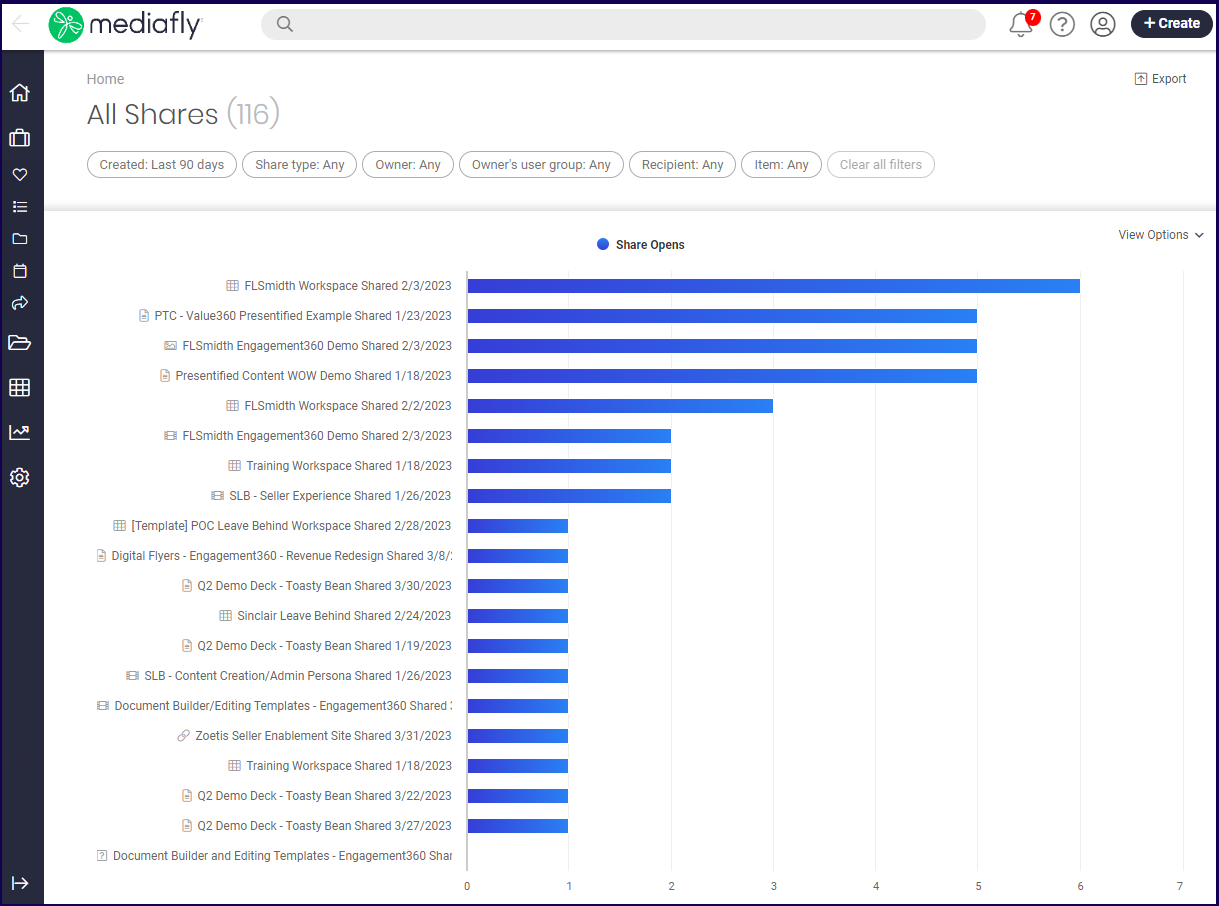
Shares
The Shares insight reports displays the list of all items that have been shared. The report can be used to view the number of share opens the shared item or workspace has had, or the total view time within the set date range.
Notes:
- Admins of organizations may not want to inflate insights of share views due to internal users accessing the share link. To resolve this, the internal users who views on a shared item and should not be counted must be given permission to the Workspace and access it within their Mediafly environment.
- To create a filter that excludes user groups so that the insight share views are not inflated by internal users, refer to the Insights: Usage Reports documentation.
Share Filters
The Share report uses a user filter, Owner, and a group filter, Owner's user Group. The following filter types are used exclusively in the Share report.
Jump To:
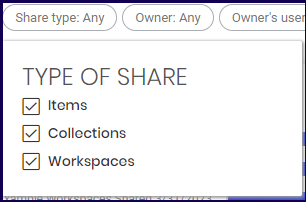
Share Type
Use this to set what type of Share to filter out. You can filter the displayed share to display only items, collections, and workspaces. Mark the type of the shared item to be displayed on the report.
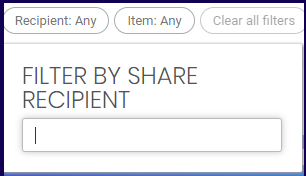
Recipient
Use this to filter the share reports based on the recipient of the shares. Use the field to specify the email address of the recipient of the share.
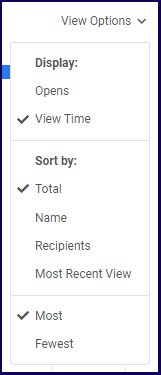
View Options
The View options are used to switch between the share opens report, or the view time report. This also allows you to sort the order of the shared reports.
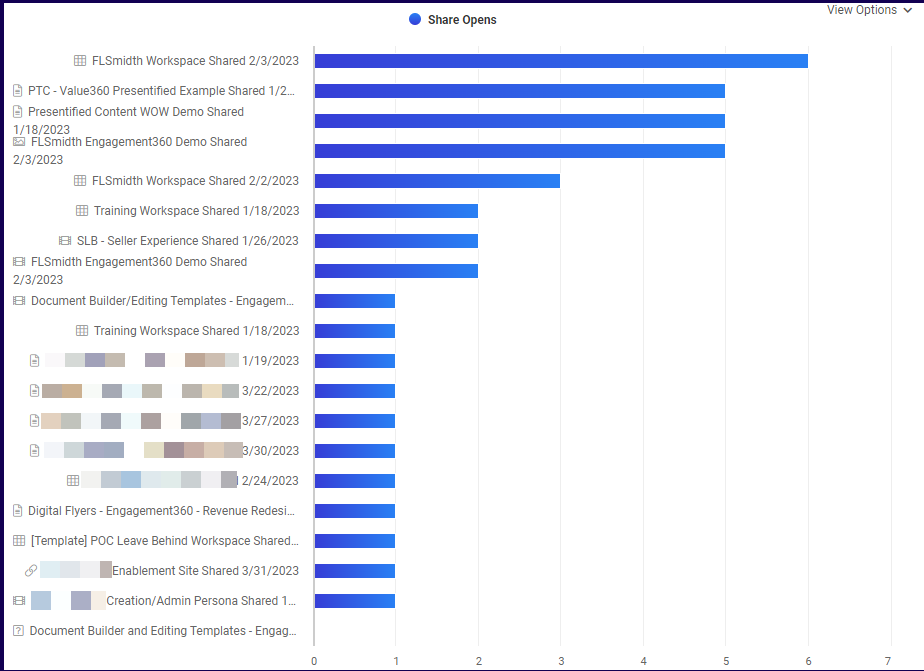
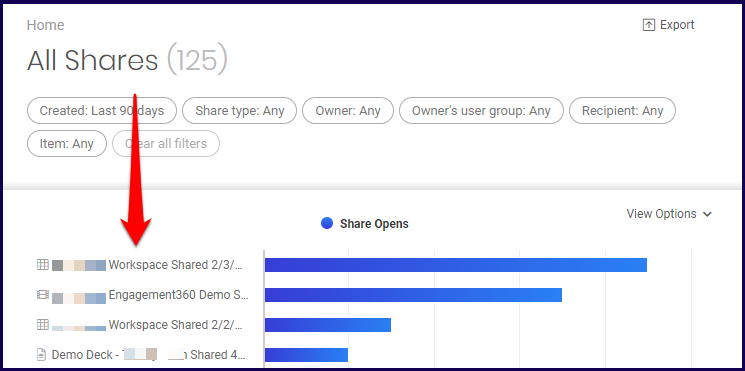
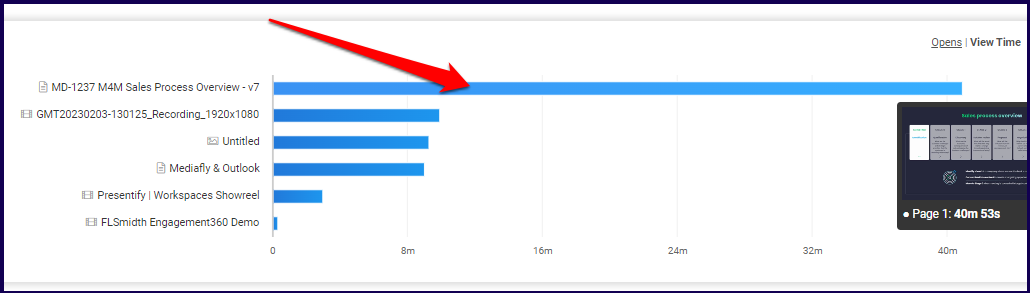
Shares Report
Share reports presents the name of the shared item or workspace and depending on the selected view options. You can check the number of views for each share and the view time.
Clicking on the item or workspace, or the corresponding bars in the chart, opens the item or workspace share details.
Refer to Share item Details for the item share detail and to Share Workspace Details for the workspace item detail.
Jump to:
Share Open View
The Share opens show the name of the shared report and the number of opens made on the report. In the example below, the share open view is sorted according to most share opens and is presented in descending order.
View Time
The View Time report shows the total view time of each shared item. In the example below, the shared item name is sorted according to the item with the most view time first.
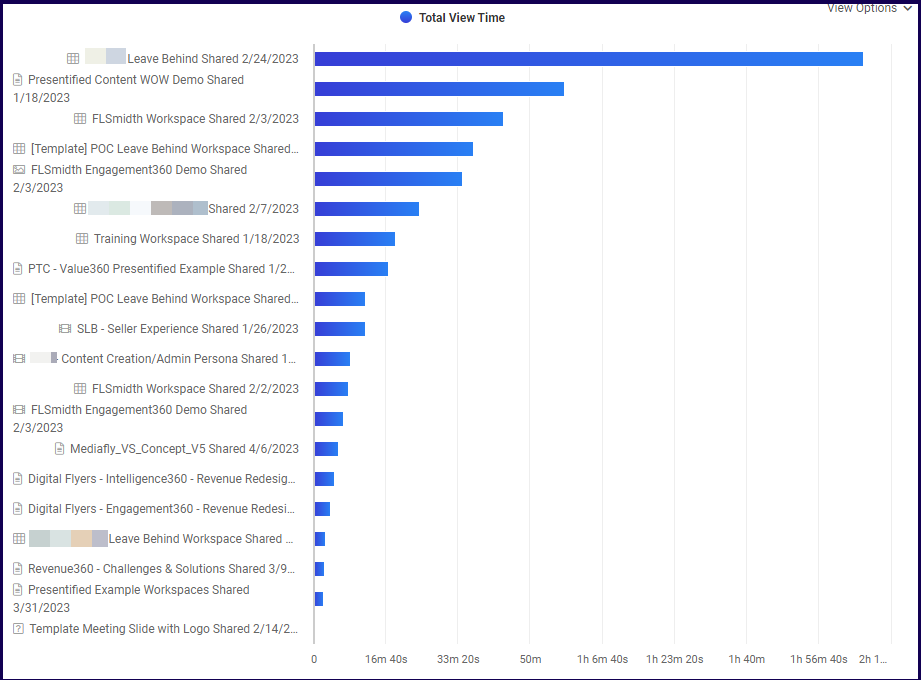
Share List
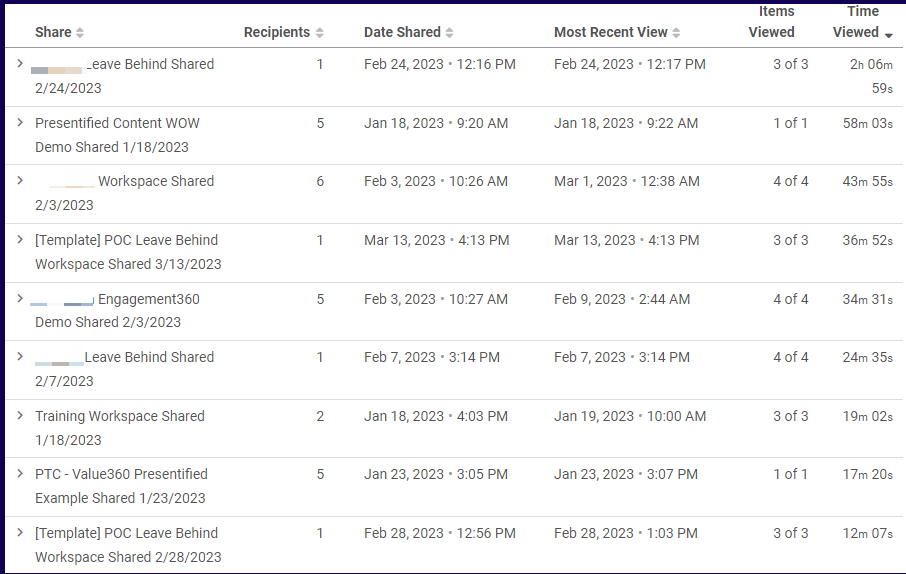
Below the shared report, the item list which displayed more details of the report including the Share Open View and the Time viewed.
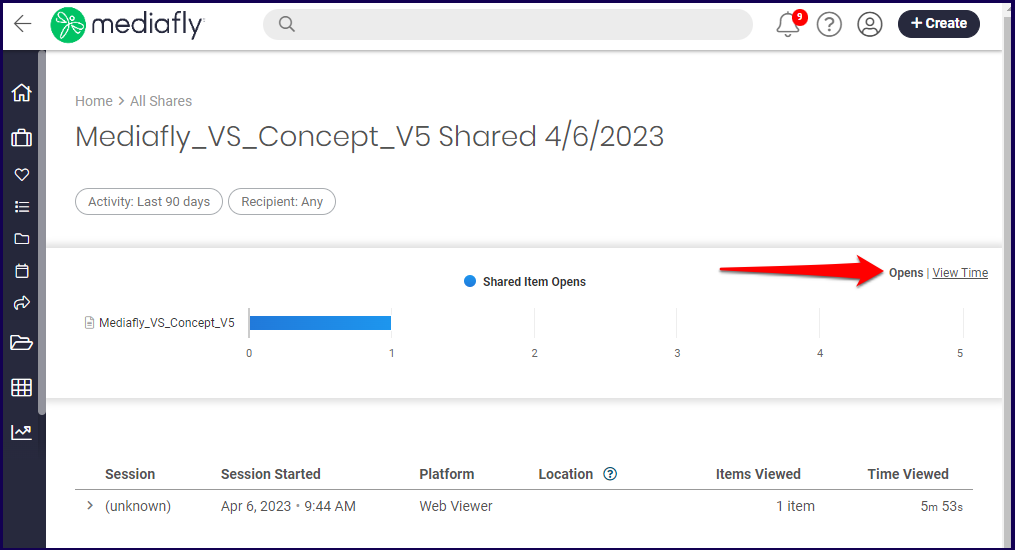
Share Item Details
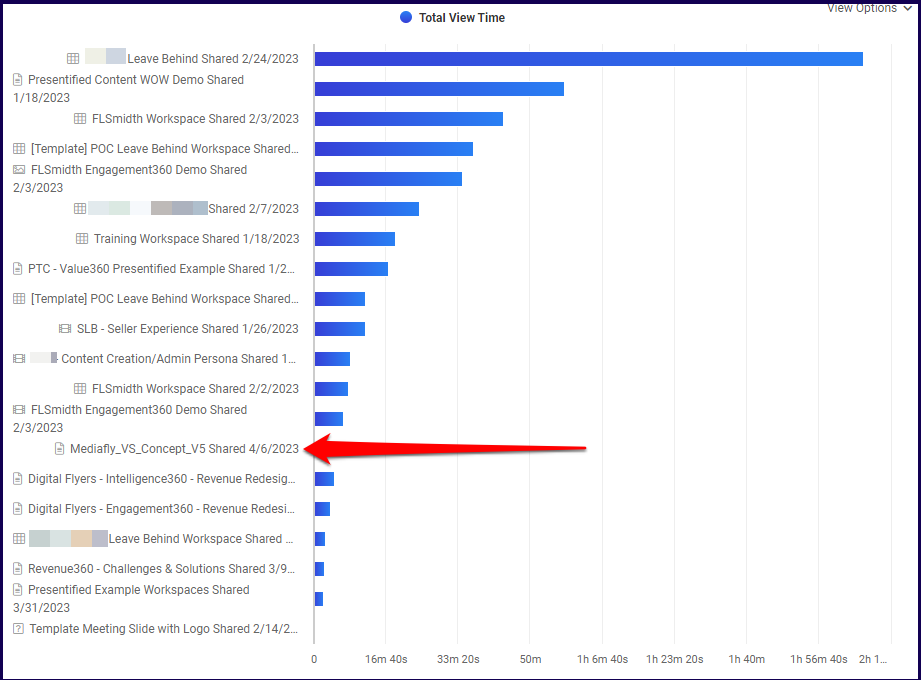
Clicking on and item in the All Shares report, or its corresponding bar in the chart, will display the Shared Item details. Clicking on one of the items in the list displays the details of the share.
The share details of the items is displayed.
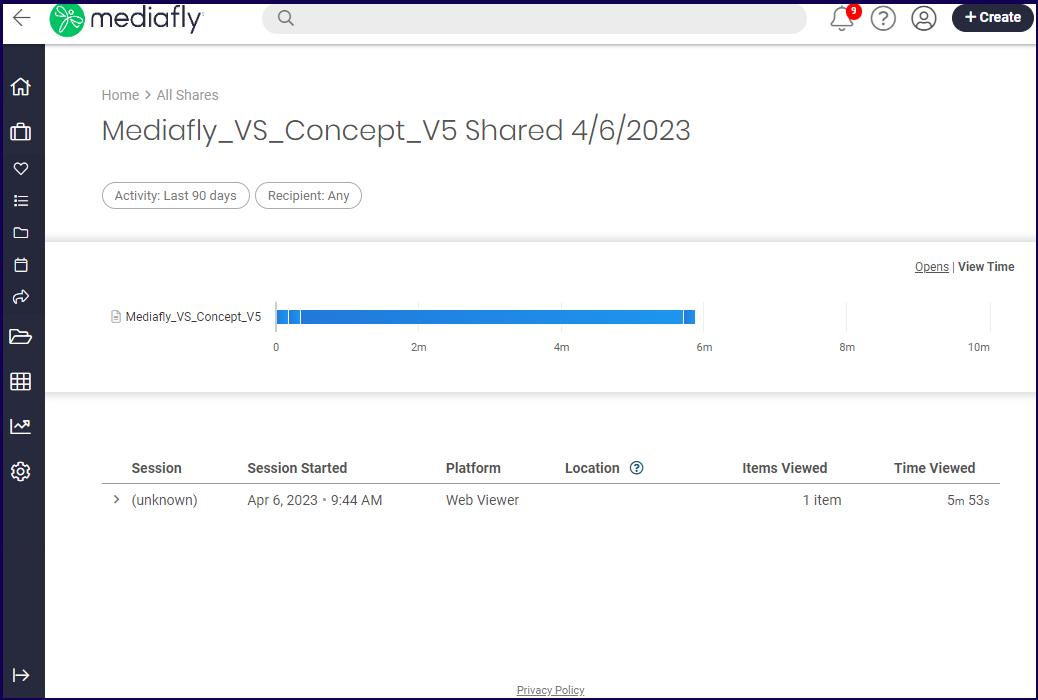
The report details can switch from one view to the other. Click on the Opens or the View Time to view the different reports.
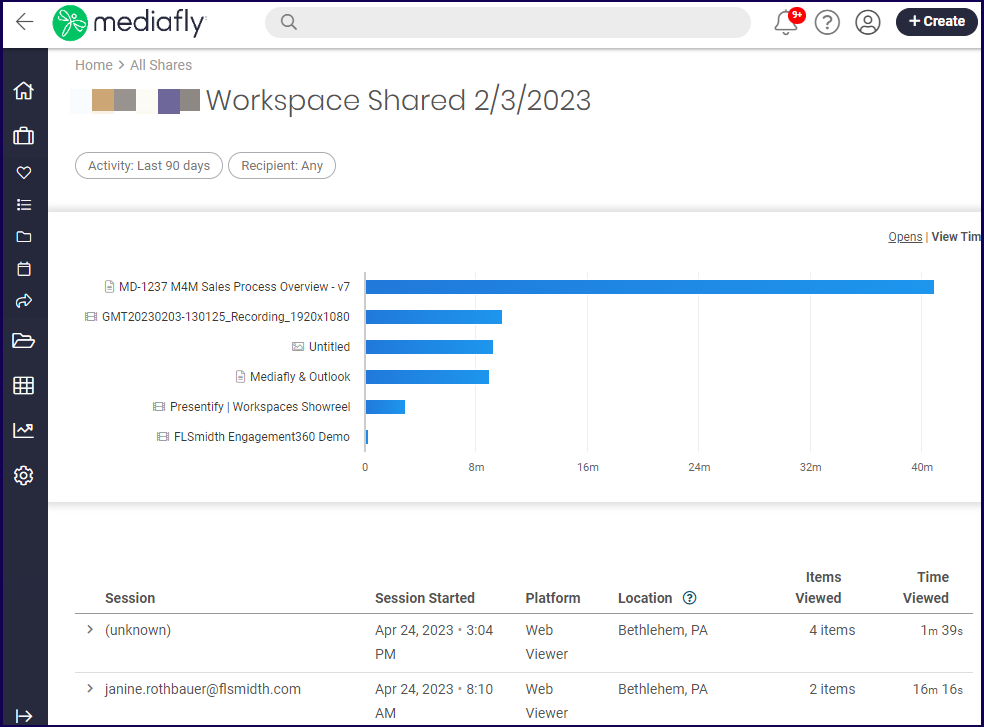
Share Workspace Details
Clicking on the workspace in the All Shares report, or its corresponding bar in the chart, will display the Share Workspace details. Clicking on one of the workspace in the list displays the details of the workspace share.
The share details of the workspace is displayed. Any items within the workspace that has been shared is displayed. Clicking on the
Clicking on the item name in the chart displays the Item Detail report.
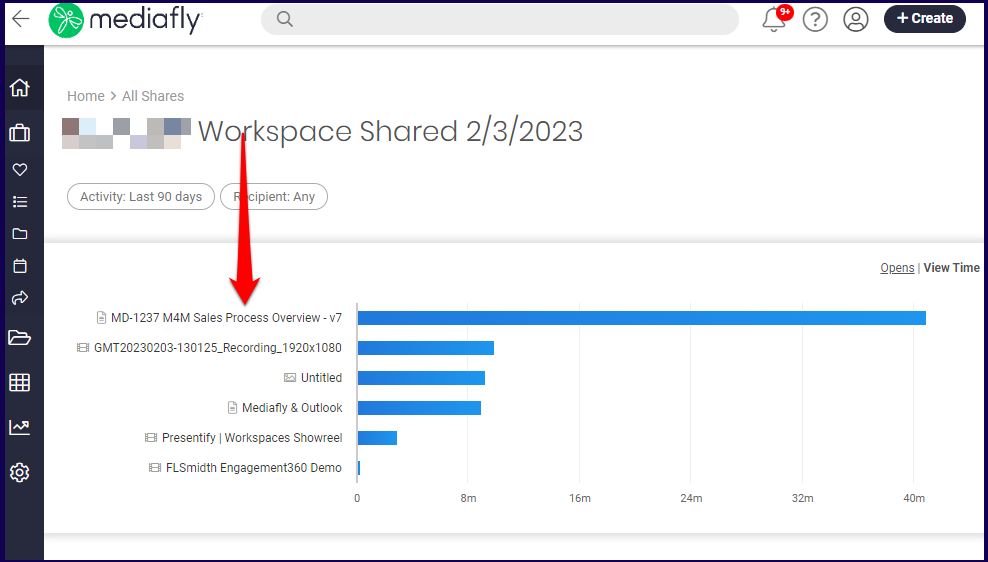
Note: Opening the item in the chart in a new window will open the item in viewer. Click on the item to view the Item Detail report.
A mini window may be displayed to show the contents of the item if the mouse is hovering over the bar. Clicking the bar of the corresponding item will open the item in viewer.
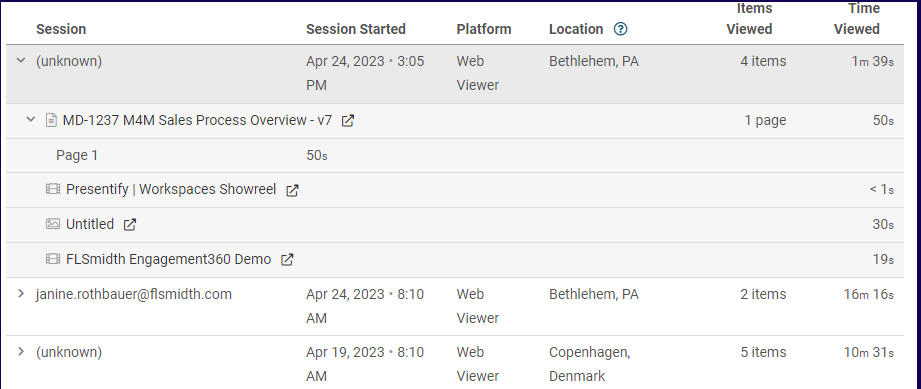
Details about the session in accessing the shared workspace is displayed at the bottom. Clicking the dropdown next to each session displays additional information on what items have been accessed. Items may or may not have dropdown options to display what pages were accessed during the session.
In the example below, the unknown session dropdown is clicked and an item has an additional dropdown that displays what page was viewed.
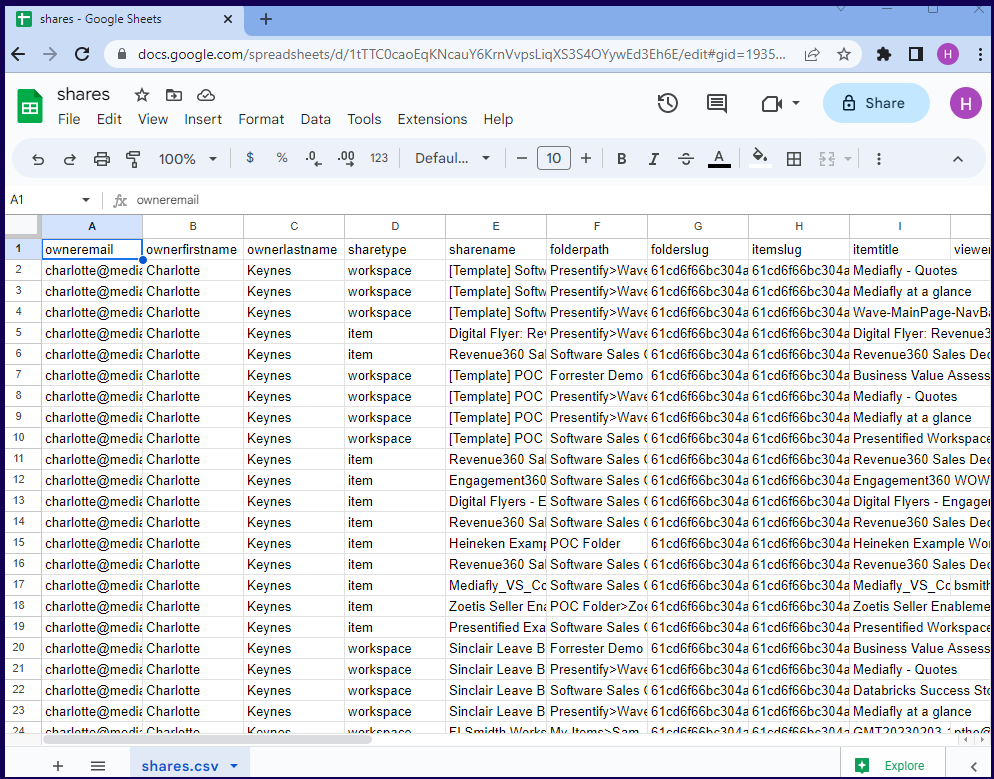
Exporting a Shares Report
An export button is provided to export the current report into a .csv file.
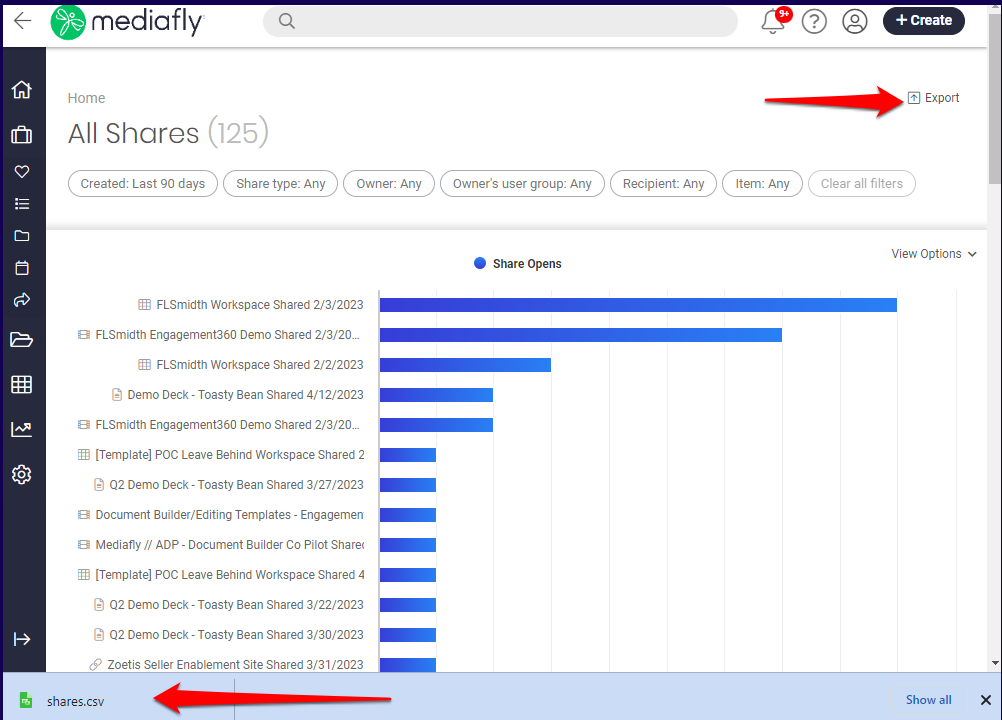
In this example, the downloaded meetings.csv file of the above report is opened in Google Sheets below.
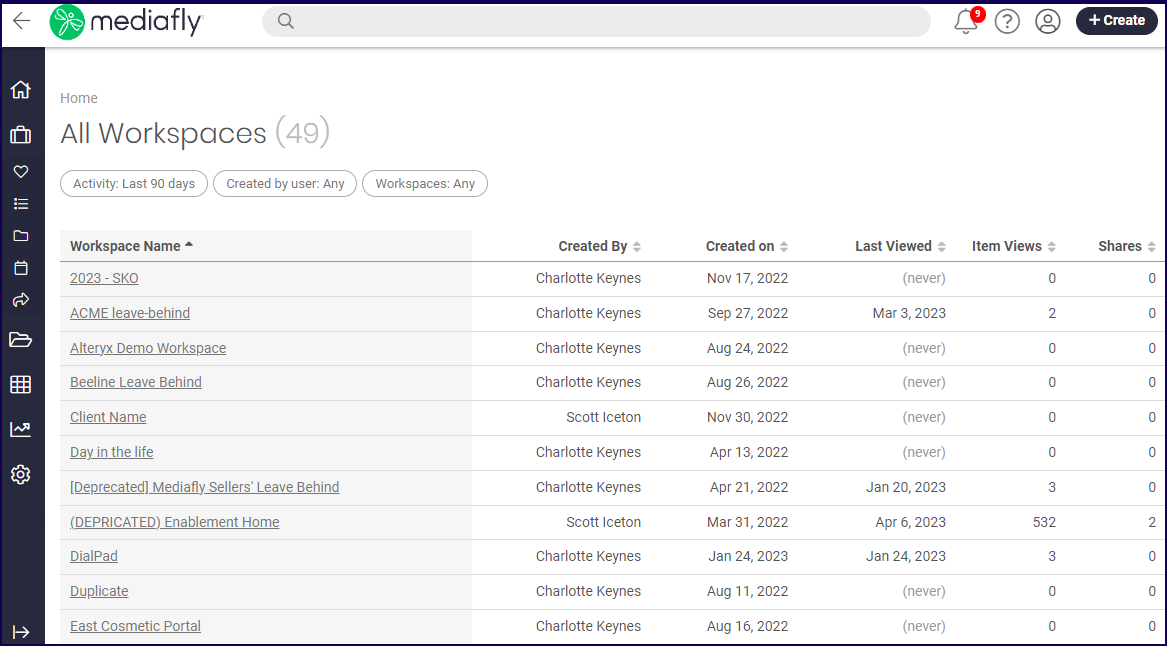
Workspaces
The Workspace reports displays the activity made on all Workspaces in the environment. Users can see when it was last viewed, the number of item views and the number of shares.
Workspaces Filter
The workspace report uses a user filter, created by user. The following filter types are used exclusively in the Workspace report.
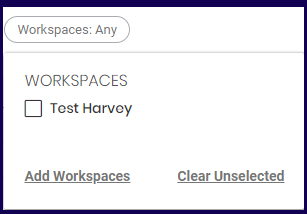
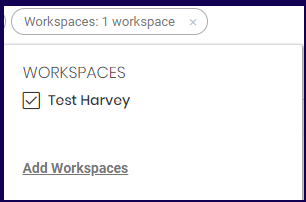
Use this to set what Workspaces reveal. Click on the Add Workspaces button to search for workspaces.
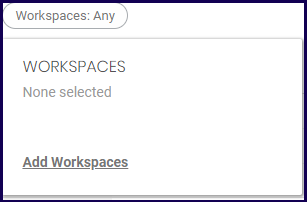
Once the Add Workspaces has been selected, the search field is displayed. Type the name of the Workspace and the system retrieves the names of the Workspaces.
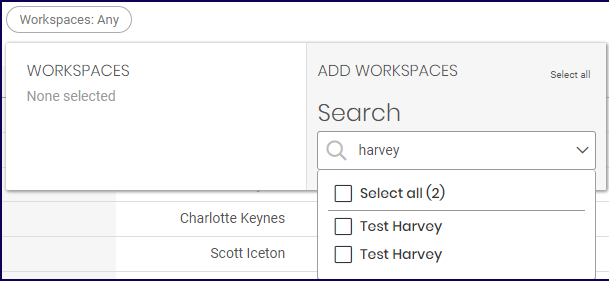
Once a Workspace has been marked, the workspace is displayed in the filter list.
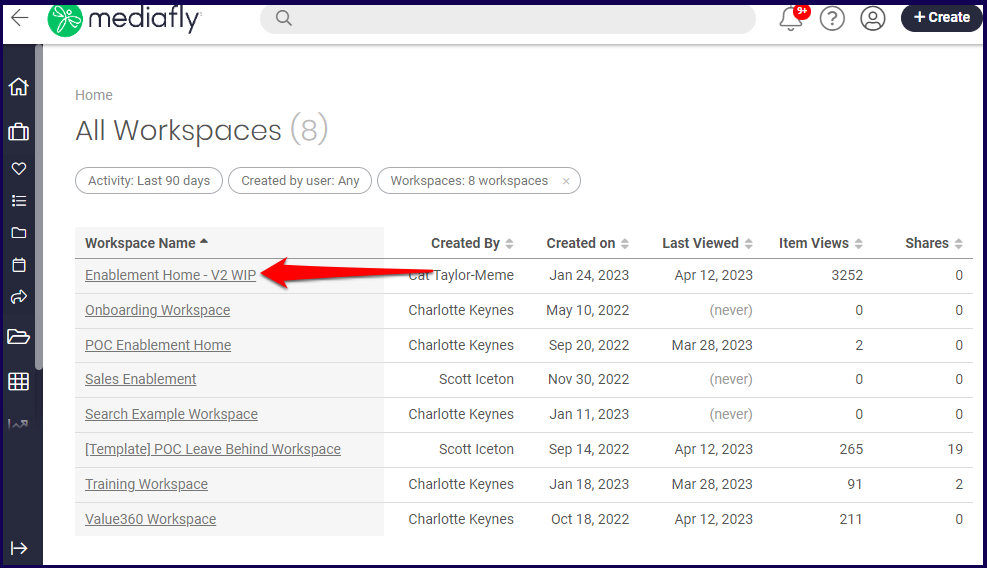
All Workspace Report
The Workspace report displays the details of the workspace including how many item views and how many shares the the workspace has.
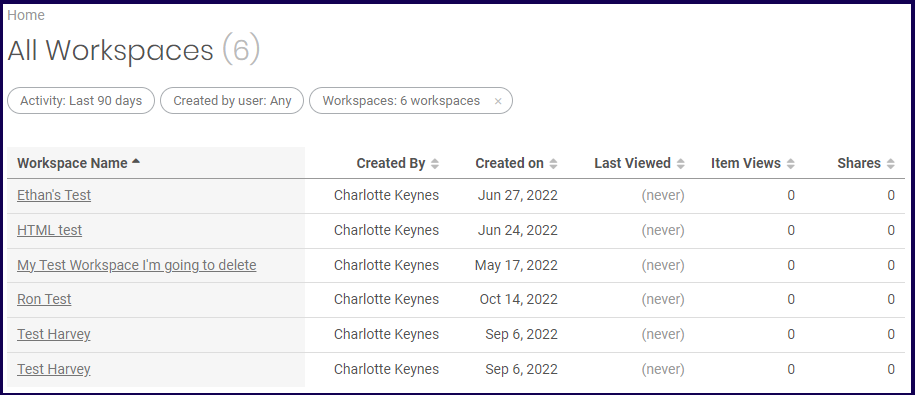
The list of workspaces may be sorted using the column sorter. Click on the corresponding column to sort the items according to each sorting order.

Workspace Detail
Clicking on the item in the report will display the Workspace details. In the example below, the workspace Enablement Home - V2 WIP is selected.
Jump to:
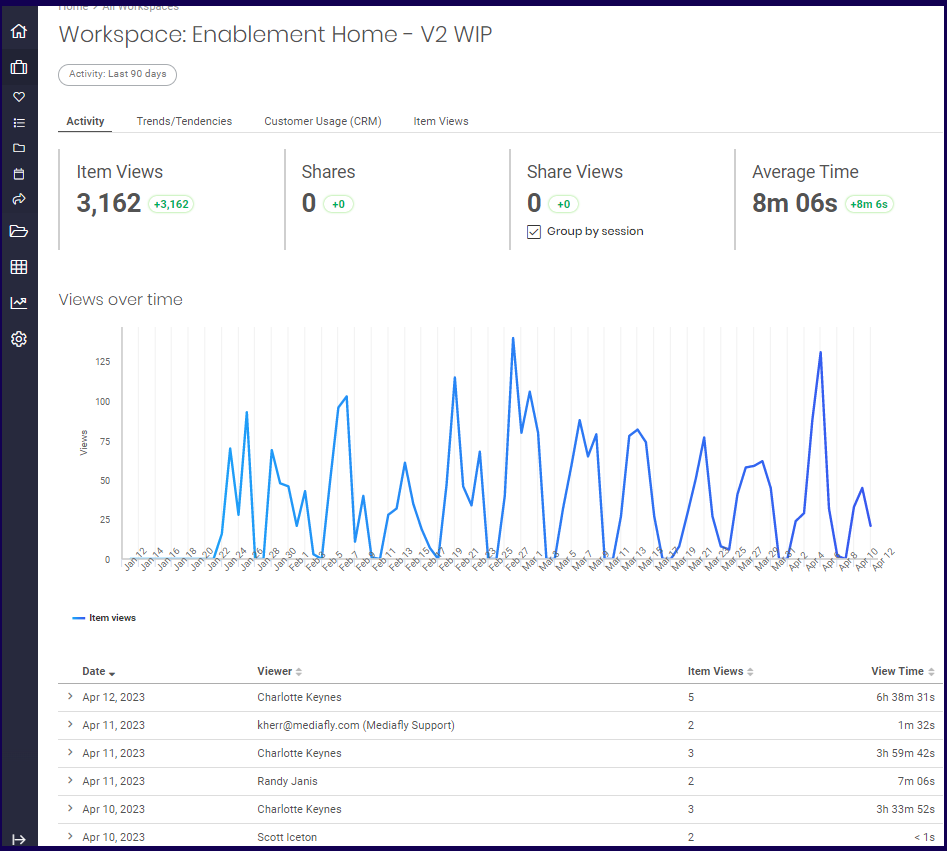
Activity Tab
The Activity tab displays the workspace summary and the Views Over time sections.
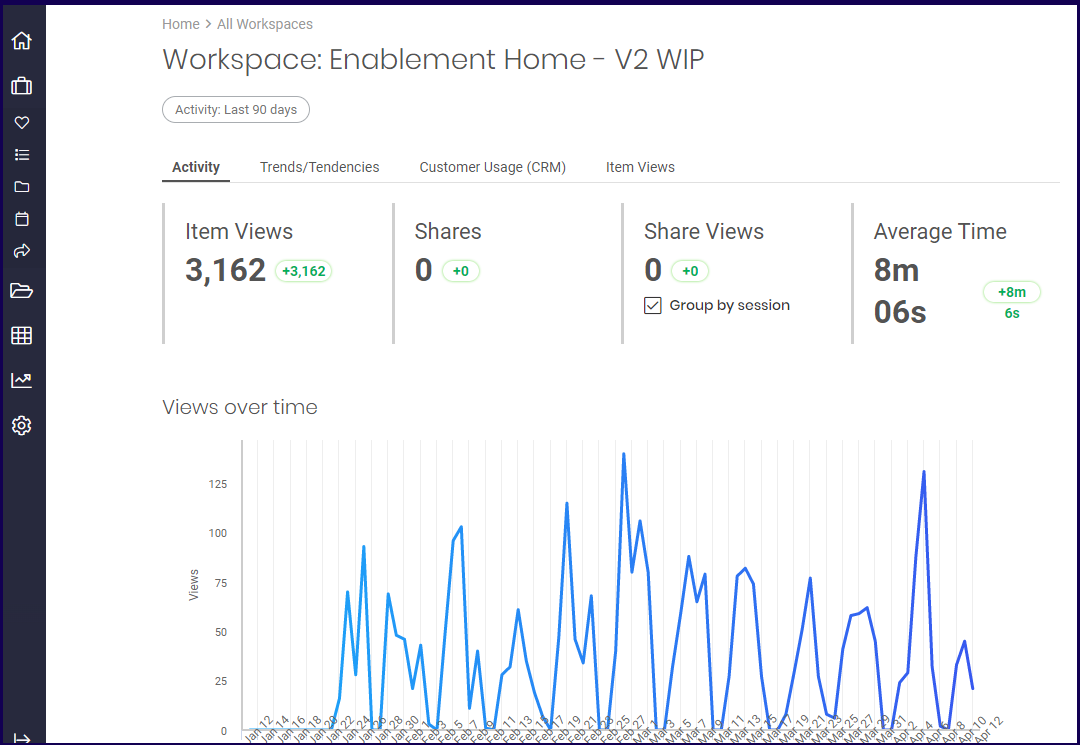
Summary Section
The summary sections displays four stats of the workspace: The Item views, shares, share views, and Average Time.
- Item views- refer to the number of views made on all items inside the workspace.
- Share- refers to the number of items that have been shared in the workspace.
- Share Views- Refers to the number of views that users made on all shared items in the Workspace.
- Average Time- Refers to the number of minutes spent viewing the item.
Each item displays the number instances of each stat. After each stat record, a number is displayed next to it number when compared to the previous period.
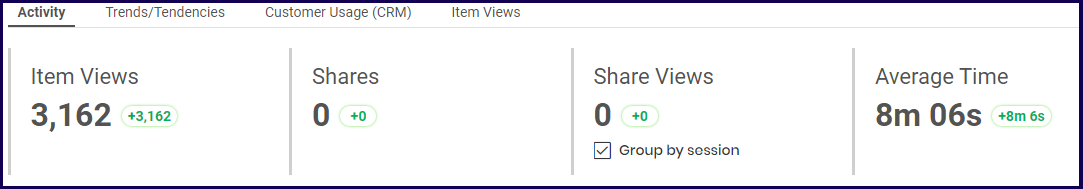
In the example above, the following interpretations is made per stat item:
- Item Views- There are 3162 items views in the last 90 days and there has been an increase of 3162 views compared to the previous 90 day period.
- Shares- There were 0 shares of the item in the last 90 days and there has been 0 shares of the item compared to the previous 90 day period.
- Share Views- There were 0 total share views made on the item in the last 90 days and there has been 0 share views in the environment compared to the previous 90 day period.
Note: The Share Views stat displays the Group by session checkmark which allows you to change the displayed views to count views made in a single session as one. Refer to the Group by Session discussion for more information on the Group by Session button. - Average Time- There were 0 meetings held in the environment in the last 90 days and there has been a 100% decrease of meetings recorded in the environment in the last 90 days compared to the previous 90 day period.
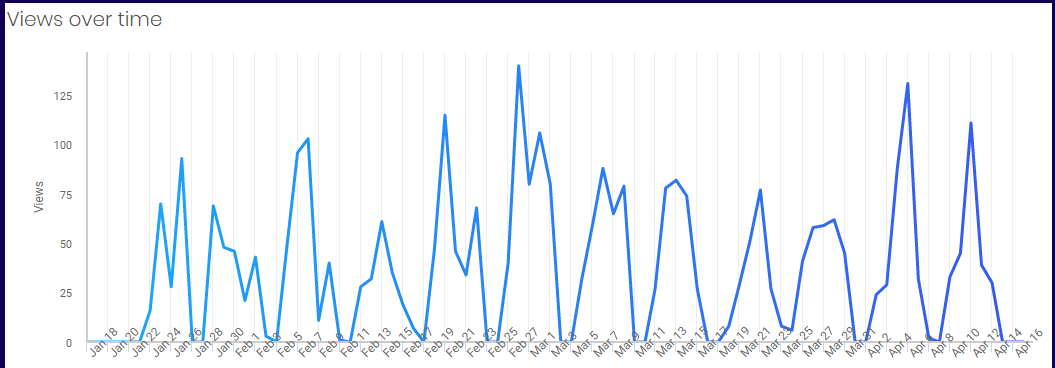
Views Overtime
The Scores Overtime section shows a chart of the item's Engagement and Sales Score within the selected Date Range.
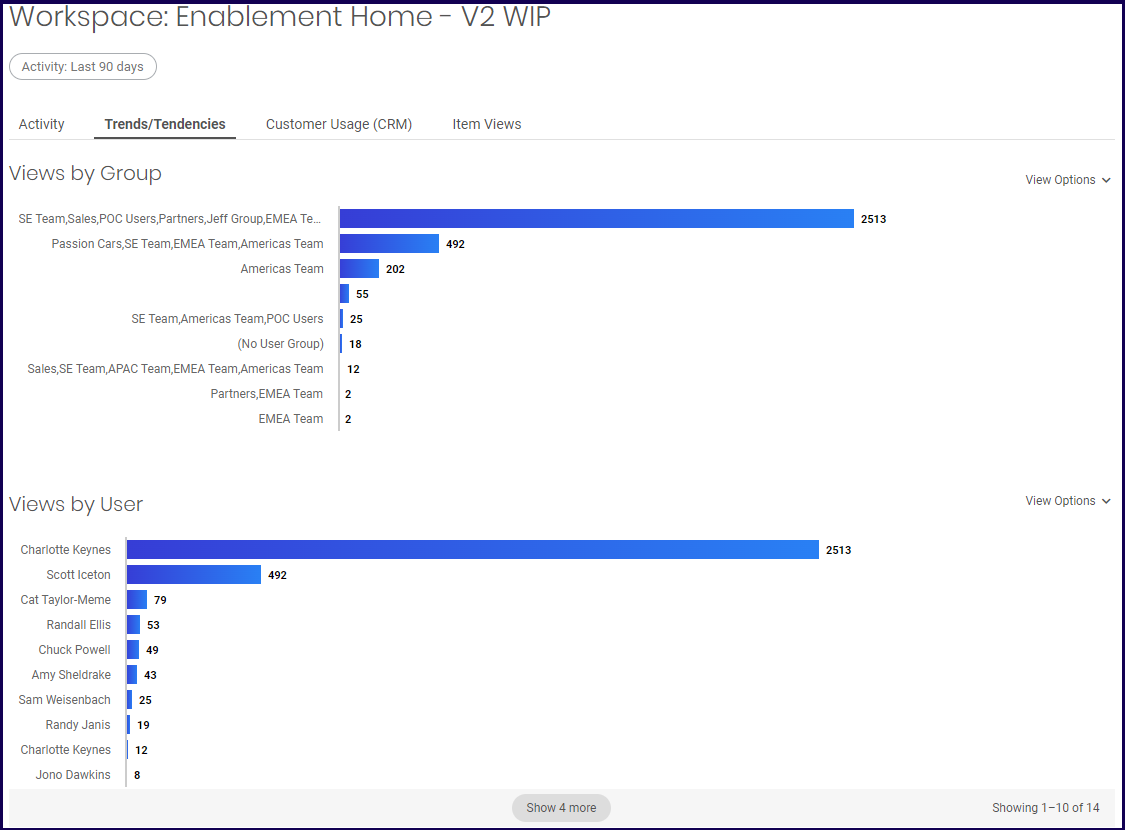
Trends/Tendencies Tab
The Trends/Tendencies tab displays the Views by Group and the View by User.
Note: The View Options allows you to switch the report to display Views, or View Time.
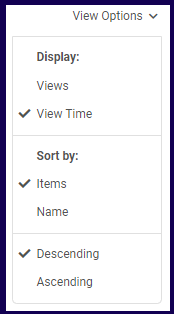
Views:
View Time:
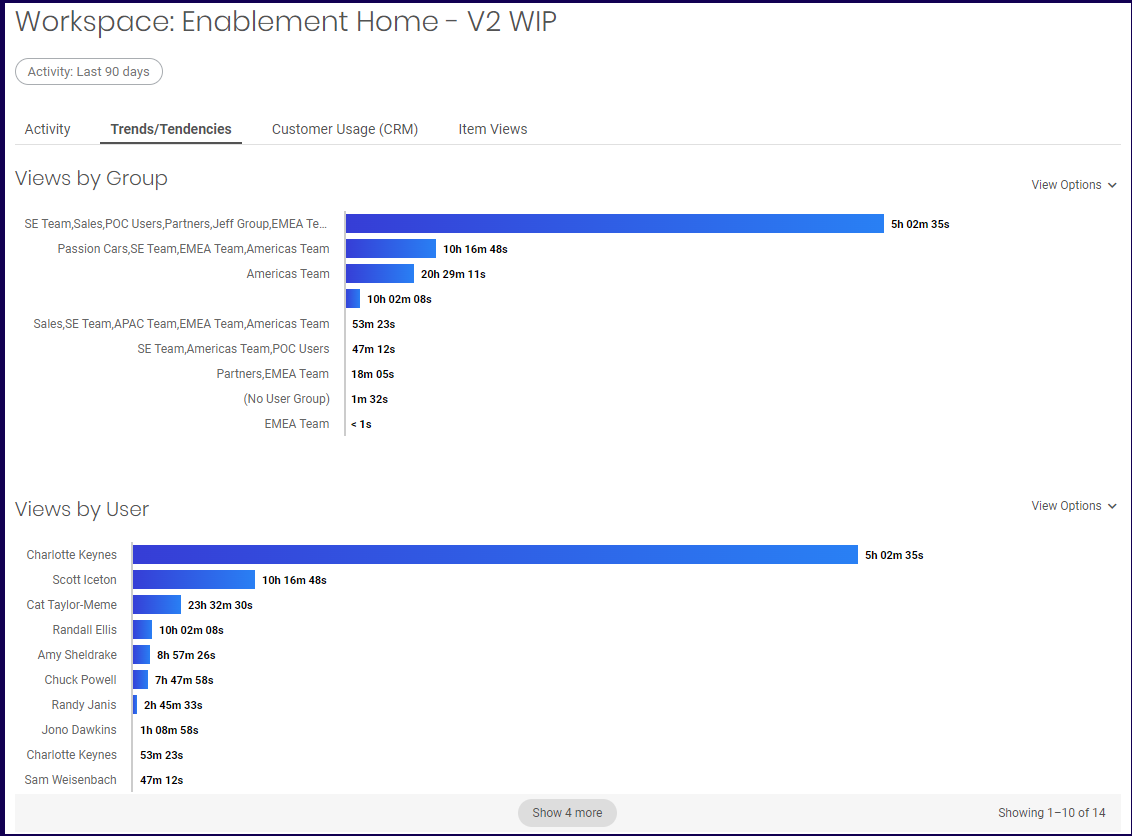
Note: Since users may belong on multiple groups, the total Views by Group may exceed the actual number of views as a user may be counted twice on two groups.
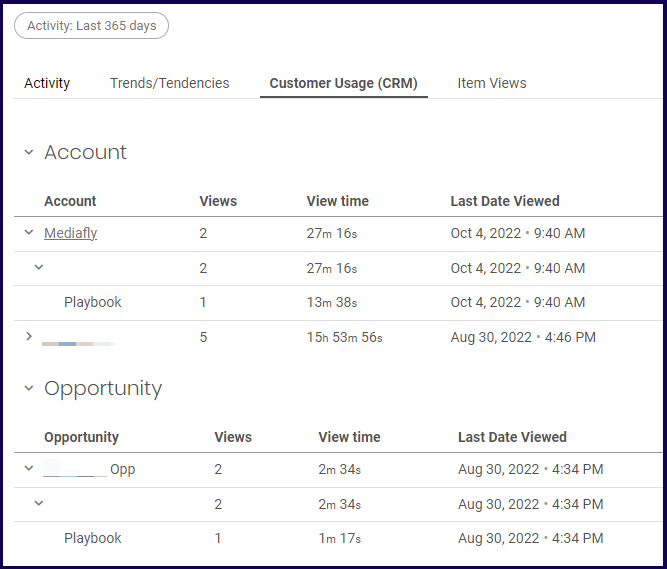
Customer Usage (CRM) Tab
The Customer Usage tab displays any views based on specific Accounts or Opportunities.
Each section displays the account or the opportunity and clicking on the drop down arrow displays more detail. This tab displays the number of views, the time viewed and the last date viewed.
Item Views Tab
The item views tab displays the items viewed within the workspace.
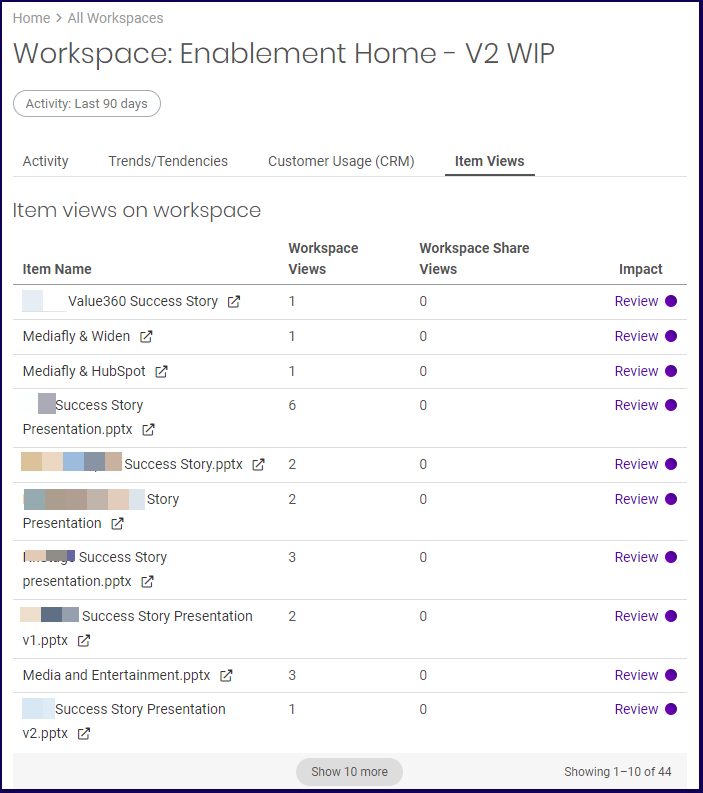
Clicking on the items displays the item detail. For more information of the Item detail, refer to the Item Detail section in the Insight: Item Report.
Meetings
The Meetings report displays the Most Used Content of every meeting, the top reps who hosted meetings, and the list of meetings that has taken place over the set time-period.
Meetings Filter
The Meetings report uses a user filter, User, and a group filter, Group. The following filter types are used exclusively in the Share report.
The Meetings report uses the following exclusive filters:
Account
The account filter allows you to filter out groups based on the Accounts where the meetings were held.
Clicking on the account button displays the Add Account filter button.
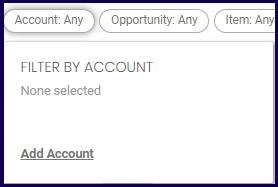
Use the search field to type the details of the account. Mark the account you want.
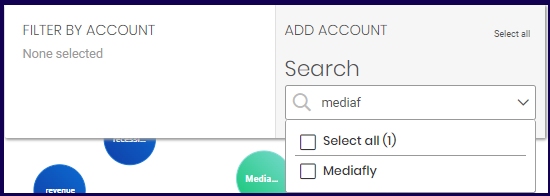
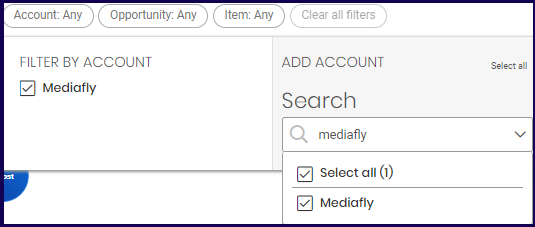
Once the Account is marked, the selected Account is displayed on the Filter by Account.
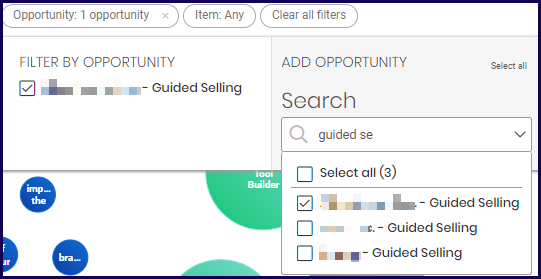
Opportunity
The Opportunity filter allows you to filter out groups based on the Opportunity where the meetings were held.
Clicking on the account button displays the Add Opportunity filter button.
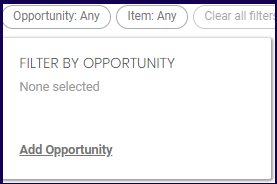
Use the search field to type the details of the Opportunity. Mark the Opportunity you want.
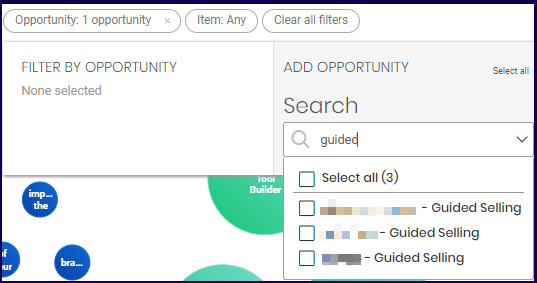
Once the Account is marked, the selected Account is displayed on the Filter by Account.
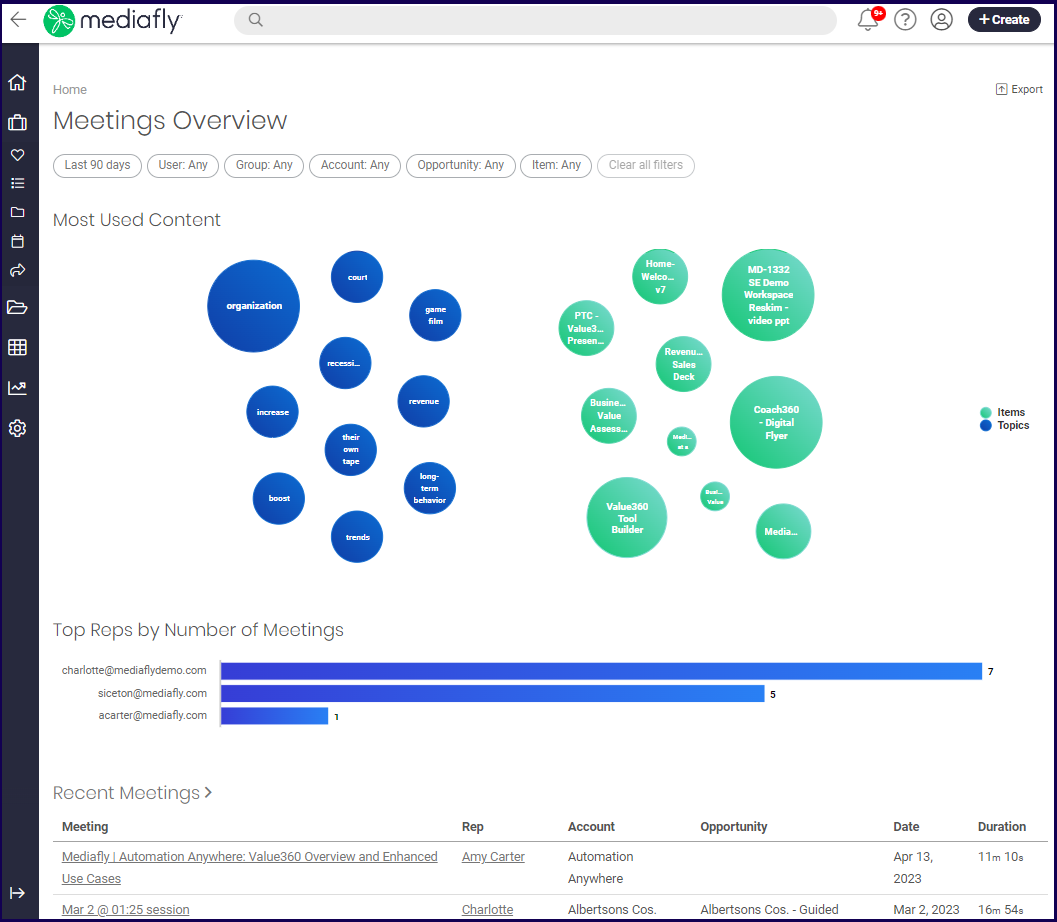
All Meetings Report
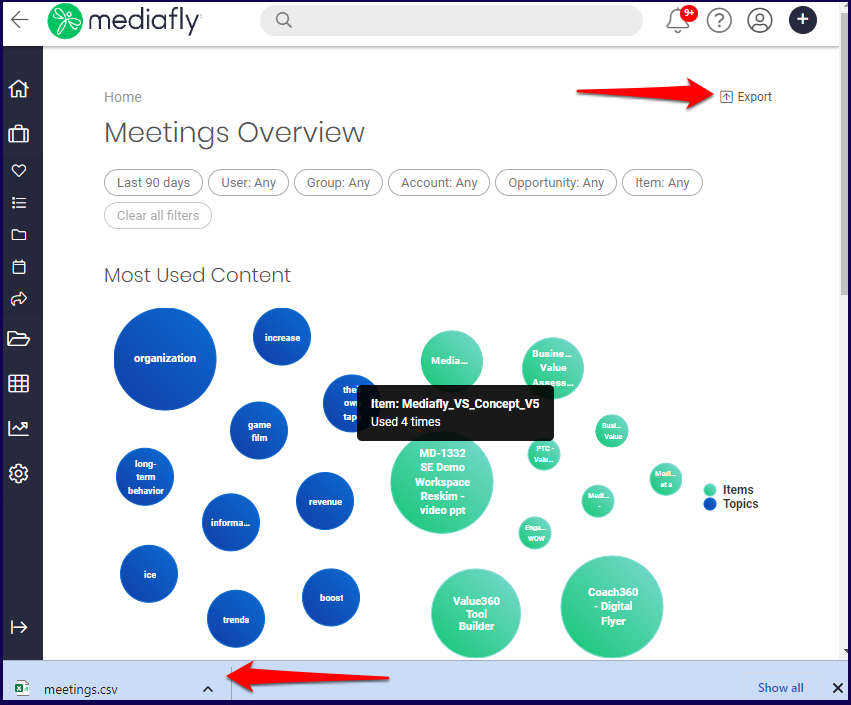
The meetings report displays which items and topics that are used most in meetings and the reps who initiated the most meeting.
Jump to:
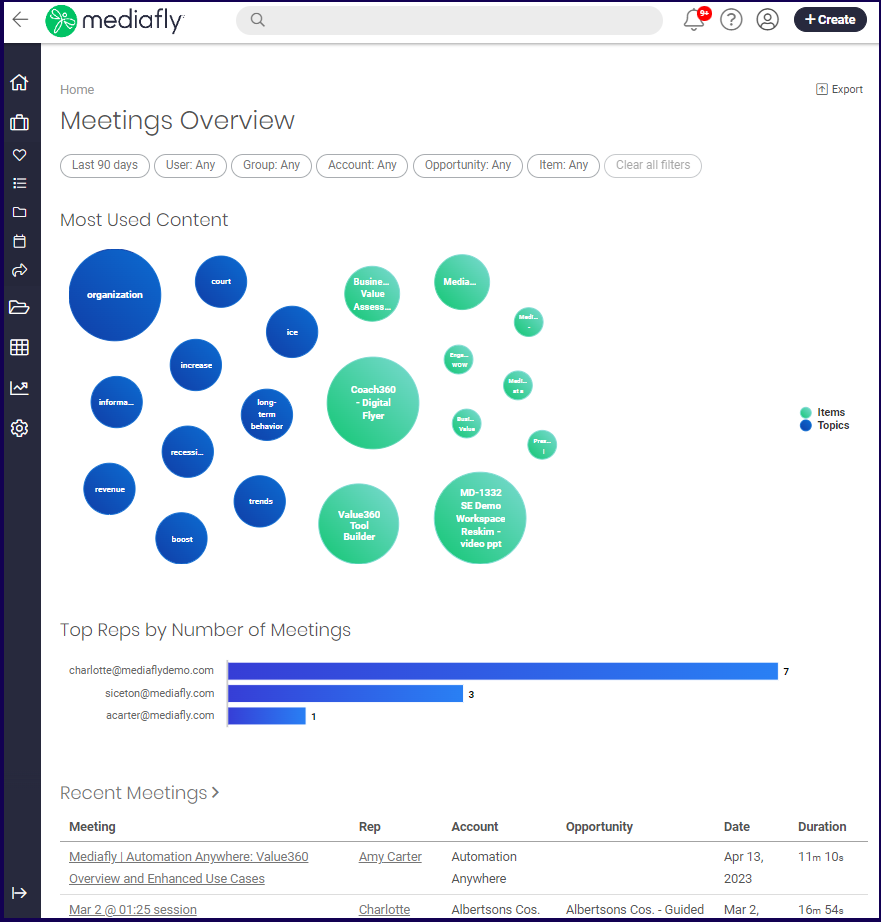
Most Used Content
The Most Used Content chart creates a visualized presentation of what contents are used in meetings. The meetings are divided in Items and Topics. This allows you to see the items or topics that are used in the meetings.
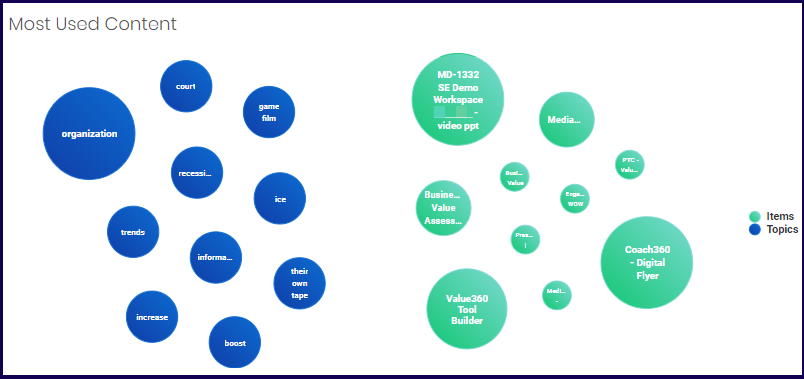
Hovering over the item allows you to view how many times the item or topic was used in a meeting.
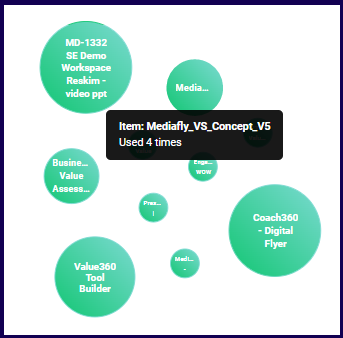
Clicking on the selected item displays the Item details. For more information on Item details, refer to the discussion on the Item Detail section.
Top Reps by Number of Meetings
This section displays the users with the most meetings in the environment.
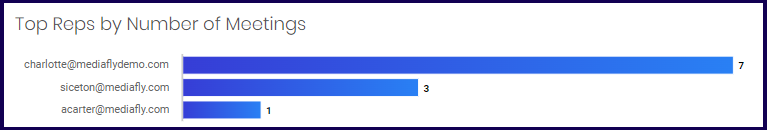
Clicking on the user displays the User Detail section. For more information on User details, refer to the discussion on the User Detail section.
Recent Meetings
The recent meetings display the list of the meetings that was held.
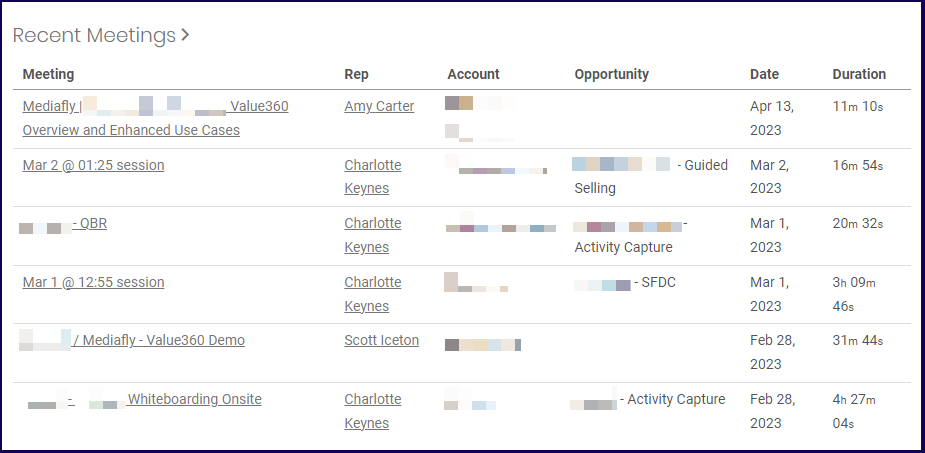
Clicking on the any of the Meetings listed here opens the Meeting Details. Refer to the Meeting Details discussion.
Exporting a Meetings Report
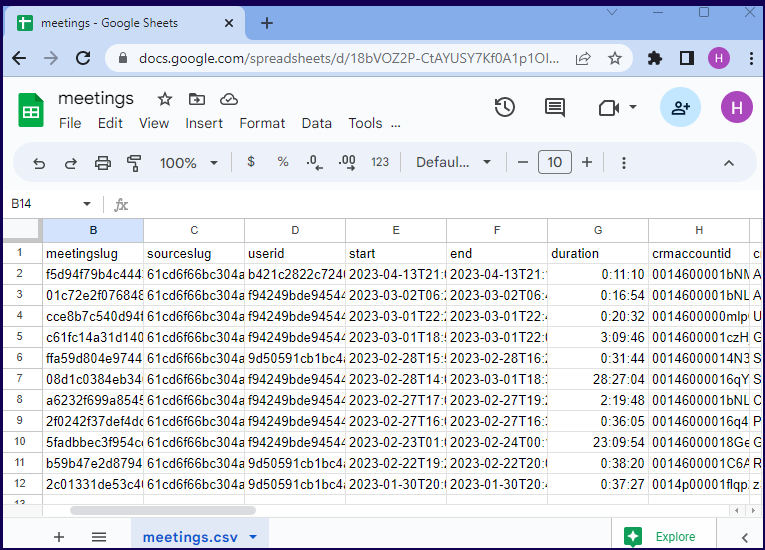
An export button is provided to export the current report into a .csv file.
In this example, the downloaded meetings.csv file of the above report is opened in Google Sheets below.
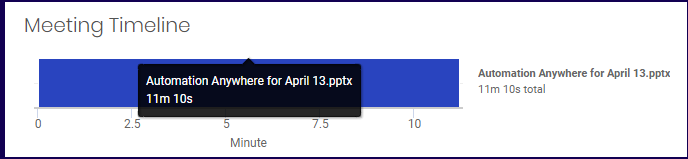
Meeting Details
The Meeting details display the timeline of the meeting as well as the Meeting Attendees.
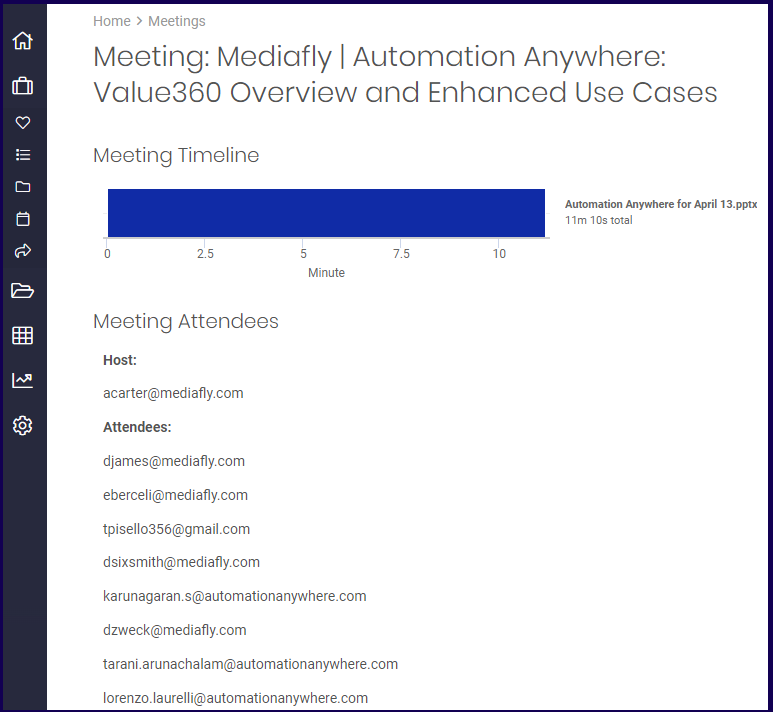
The Meeting Timeline displays the minute lengths and the item used. Clicking on the item displays the Item details.
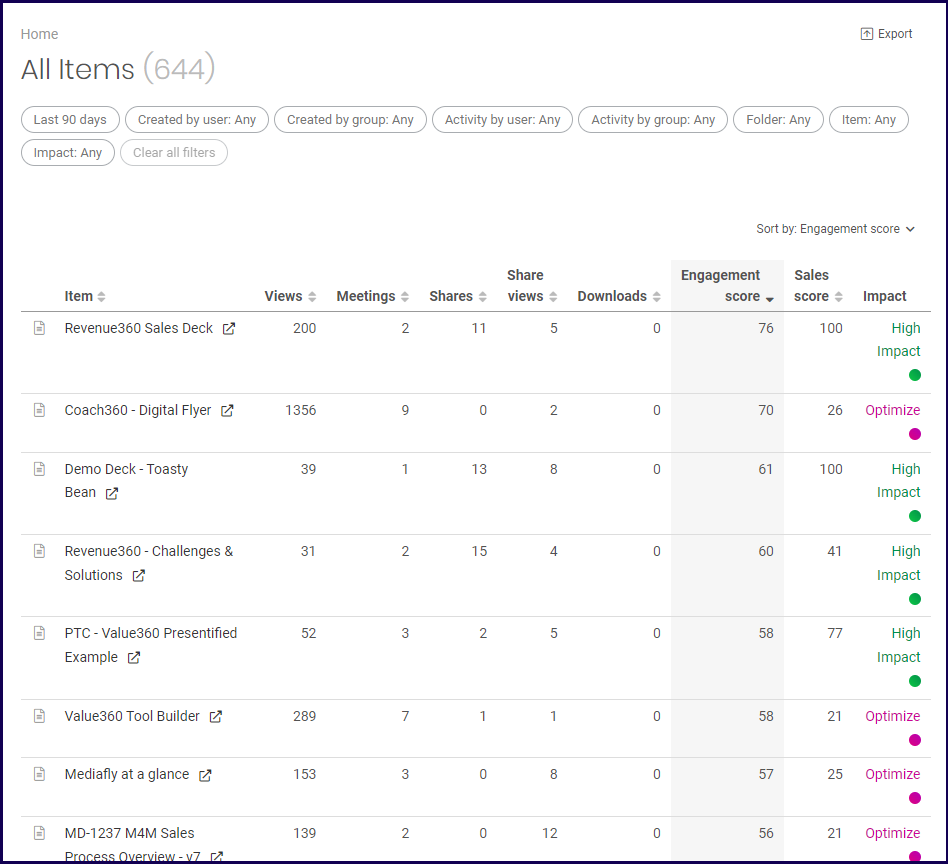
Items
The item reports display the stats of the items in the environment and sort them according to any order that you like. You can easily identify the most viewed, shared, or the items with the highest engagement or sales score.
Item Filter
The item report uses two user filters. The Created by user and Activity by User filters the users based on created and activity. It also uses two group filters, Created by Group and Activity by Group.
The Item report uses the following exclusive filters:
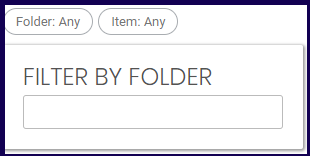
Folder
The Filter by folder allows you to filter out the items by it's folder location. Type in the folder name in the field to add the filter.
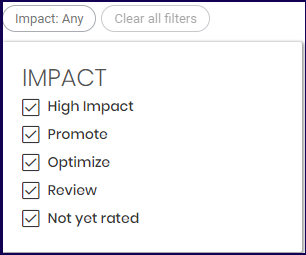
Impact
The Impact filter is used to filter the items according to their impact rating. Read the Content Impact insight documents for more information on the impact ratings.
Exporting an Item Report
An export button is provided to export the current report into a .csv file.
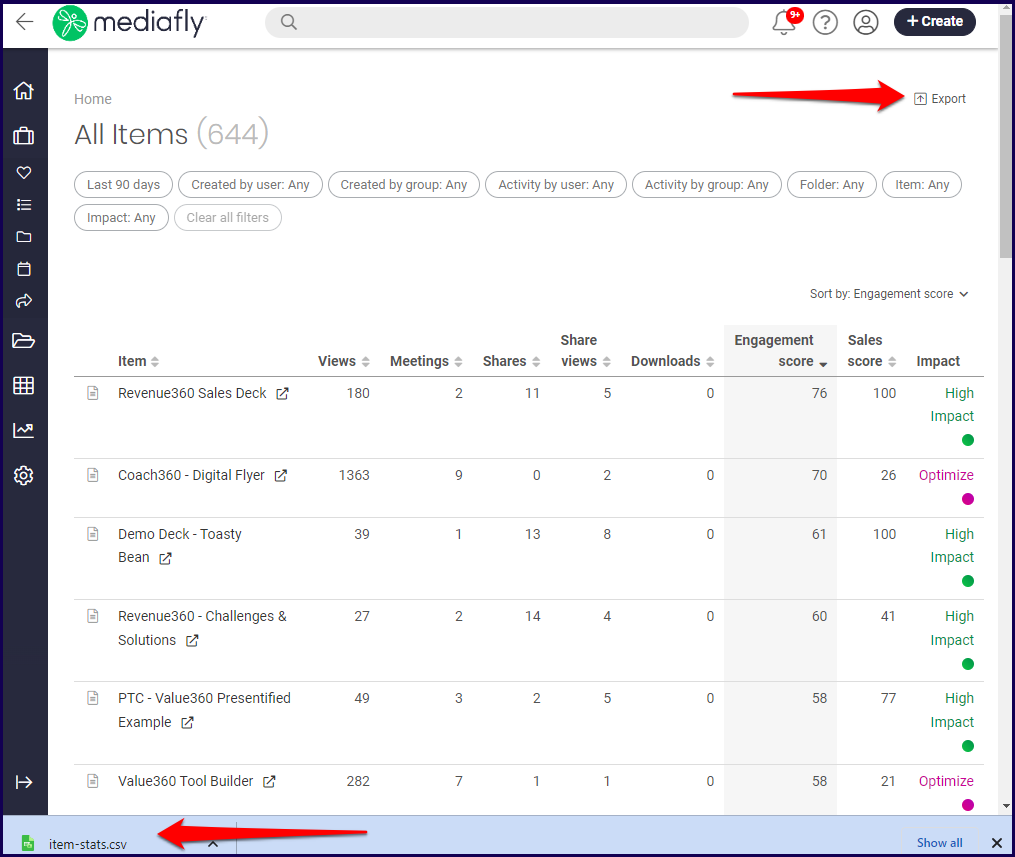
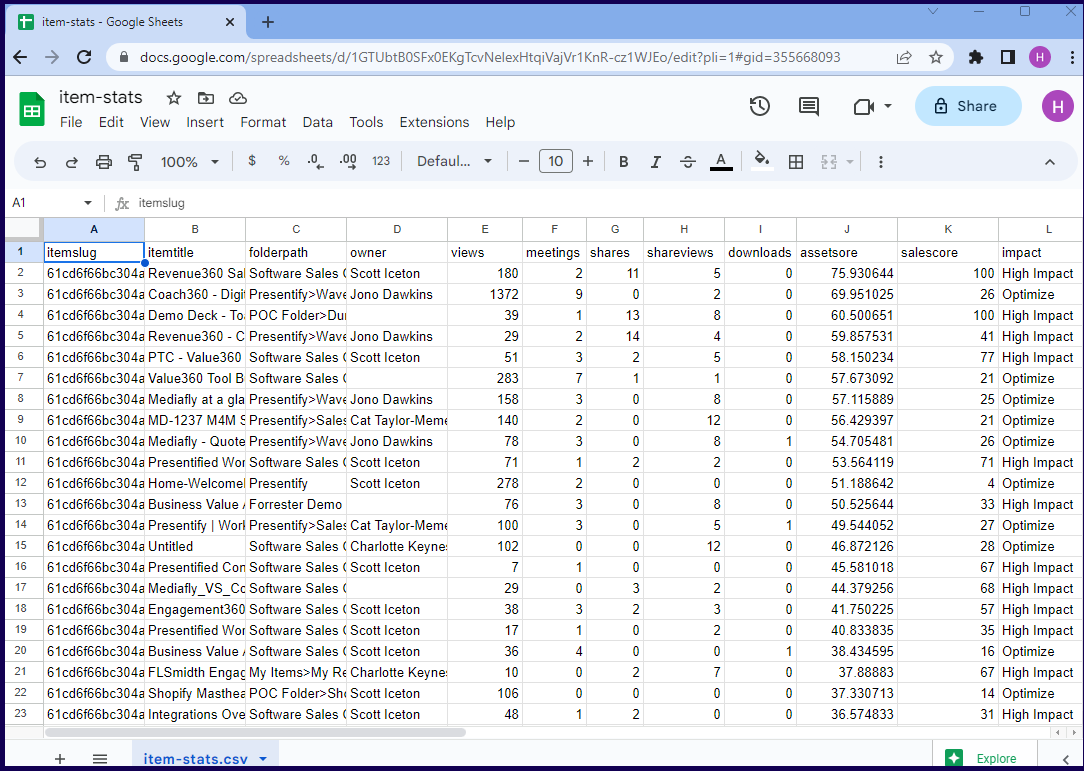
In this example, the downloaded item-stats.csv file of the above report is opened in Google Sheets below.
Item Report
It shows how many views the item has, how many meetings have been held using the item, how man item shares, share views, downloads and the Engagement and Sales scores.
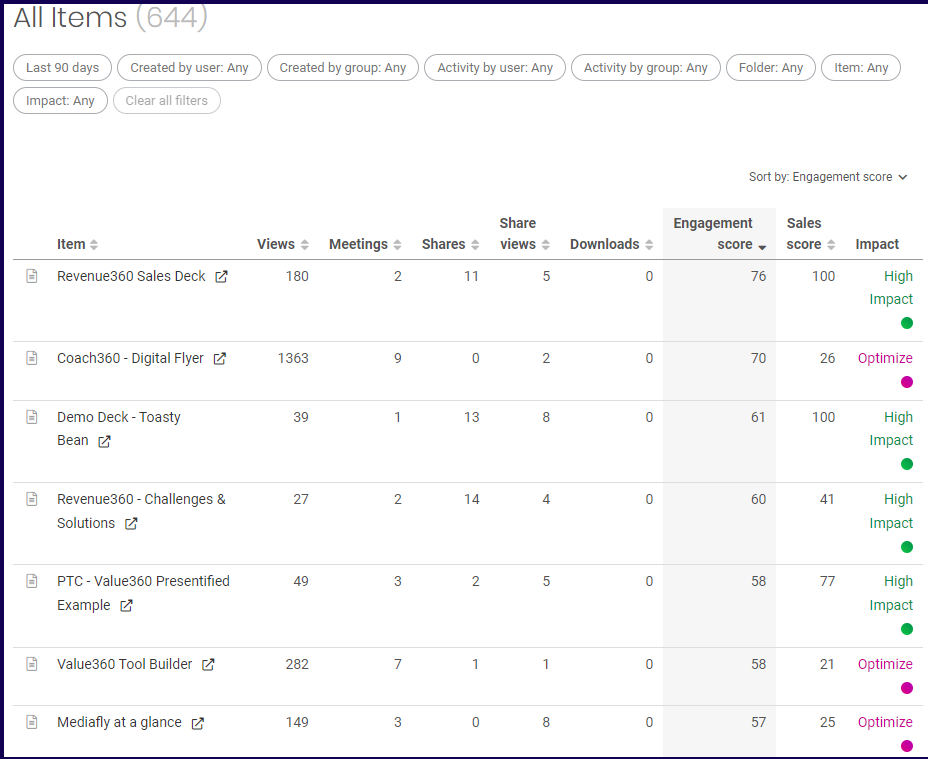
Sorting
The Item reports offers two ways to sort the items.
The sort by button can be used to select the sort by option, and the order.
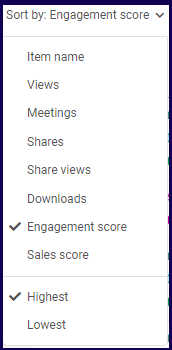
The list of items may be sorted using the column sorter. Click on the corresponding column to sort the items according to each sorting type. The arrows that appear next to the item allows you to sort it by highest and lowest.

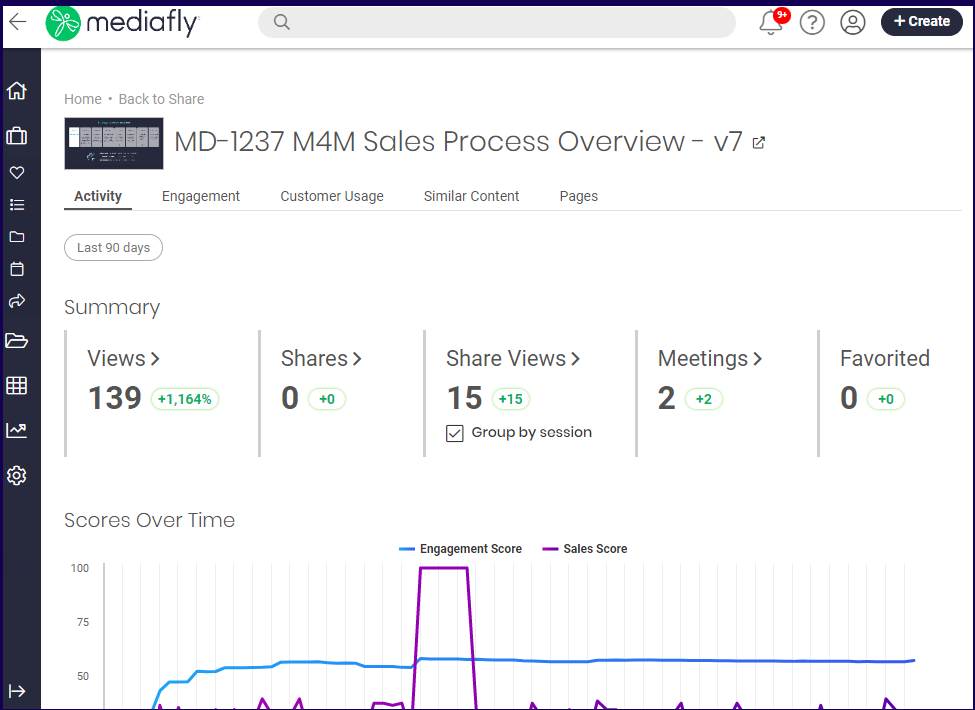
Item Detail
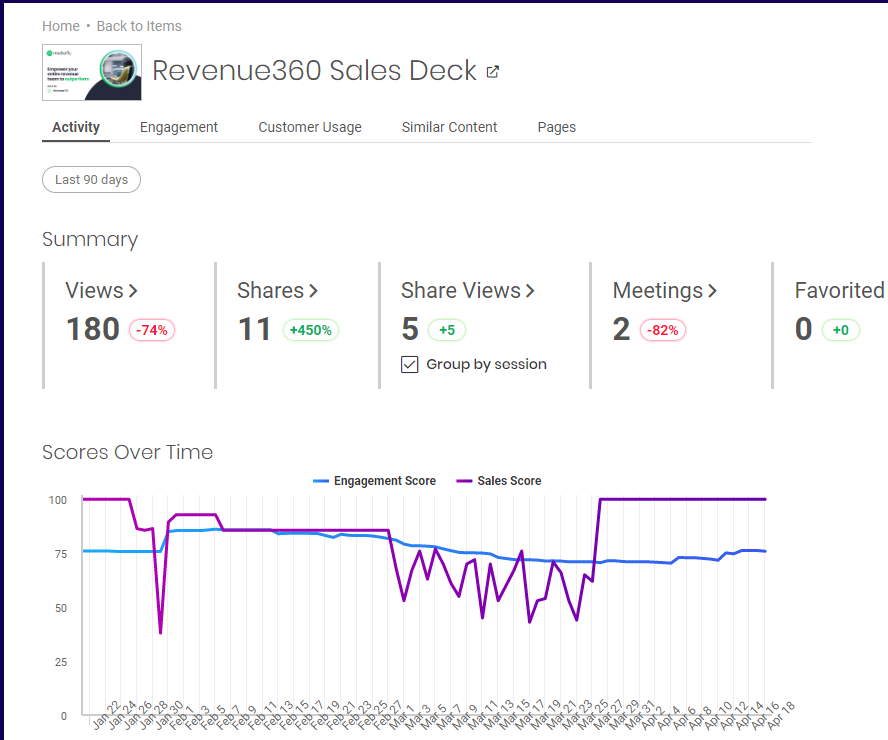
Clicking on the item in the report will display the Item details. In the example below, the item Revenue360 Sales Deck is selected.
The Item Details page displays the following tabs:
Activity Tab
The Activity tab displays the Summary and the Scores Over time sections.
Summary Section
The summary sections displays five item stats: the views, shares, share views, meetings, and favorited.
- Views- refer to the number of views made on the item.
- Share- refers to the number of times the item has been shared.
- Share Views- Refers to the number of views that users made on all shared links of the item.
- Meetings- Refers to the number of times the item was used on meetings.
- Favorited- Refers to the number of times the item has been Favorited by a user.
Each item displays the number instances of each stat. After each stat record, a percentage change is displayed next to it to indicate if there is a positive increase or decrease in number when compared to the previous period.
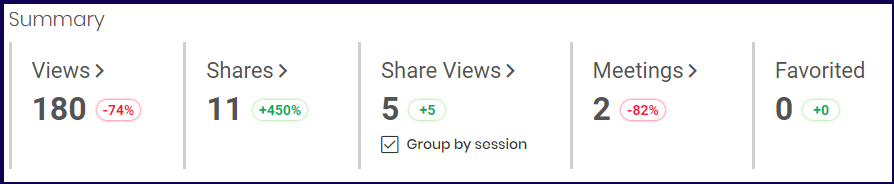
In the example above, the following interpretations is made per stat item:
- Item Views- There are 180 views and there has been a 74% drop of views of the item in the last 90 days compared to the previous 90 day period. Clicking on this opens the Views Report and automatically filters the View reports to display only this item.
- Shares- There were 11 shares of the item and there has been a 450% increase of item shares in the last 90 days compared to the previous 90 day period. Clicking on this opens the Share Report and automatically filters the Share reports to display only this item.
-
Share Views- There were 5 total share views made on the item and there has been a 5 increase of shares views in the last 90 days compared to the previous 90 day period. Clicking on this opens the Share Report and automatically filters the Share reports to display only this item.
Note: The Share Views stat displays the Group by session checkmark which allows you to change the displayed views to count views made in a single session as one. Refer to the Group by Session discussion for more information on the Group by Session button.
- Meetings- There were 2 Meetings that used the item and there has been an 82% decrease in the number of meetings that used the item in the last 90 days compared to the previous 90 day period. Clicking on this opens the Meetings Report and automatically filters the Meeting reports to display only this item.
- Favorited- There were 0 favorites of the item in the last 90 days and there has been 0 increase in the last 90 days compared to the previous 90 day period.
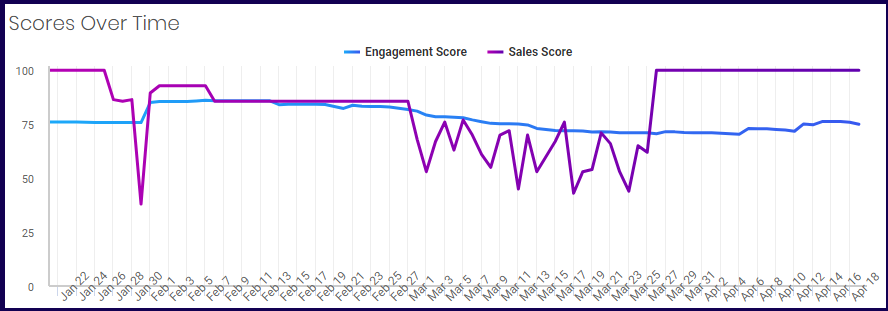
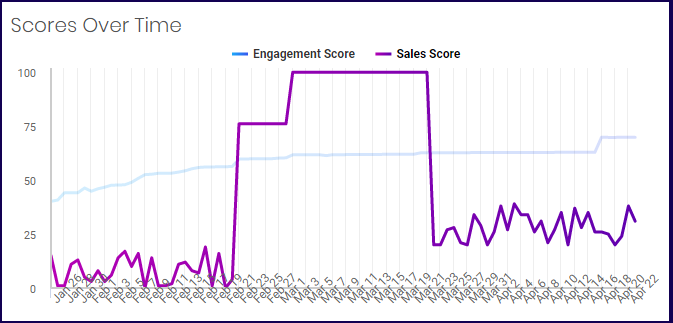
Scores Overtime
The Scores Overtime section shows a chart of the item's Engagement and Sales Score within the selected Date Range.
Engagement Tab
The engagement tab displays the Views by Group and the View by User.
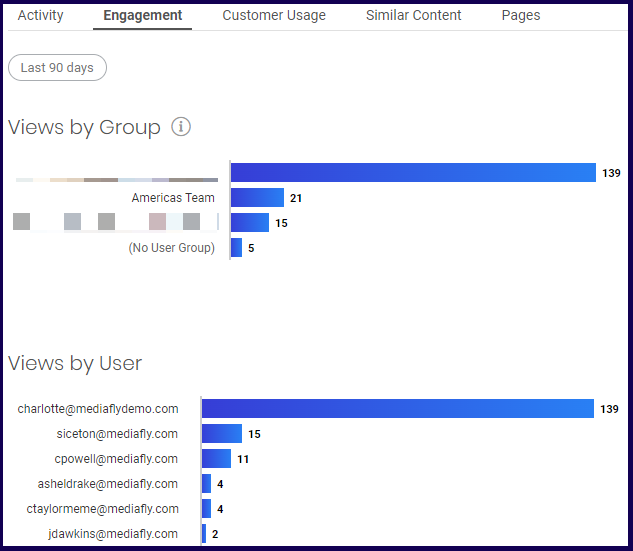
Note: Since users may belong on multiple groups, the total Views by Group may exceed the actual number of views as a user may be counted twice on two groups.
Customer Usage Tab
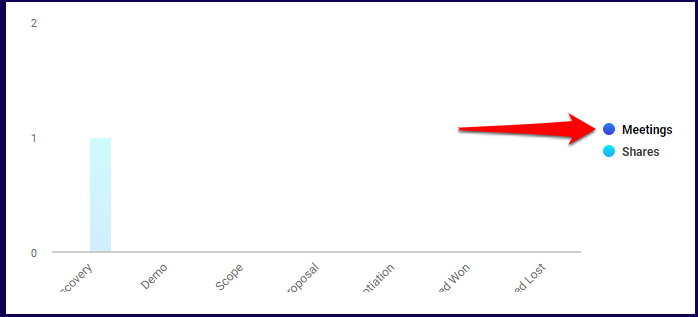
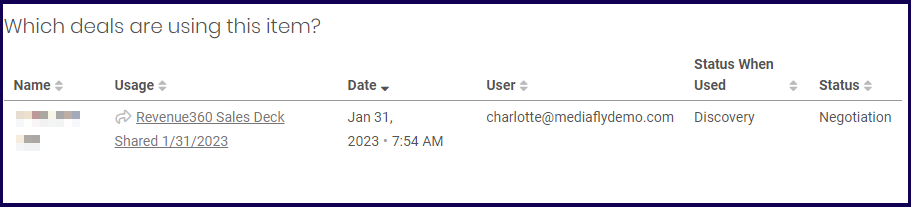
The customer usage tab displays a chart on when the item is being used. The Customer Usage tab displays the 'When is this item being used?' section and the 'Which deals are using this item?'.
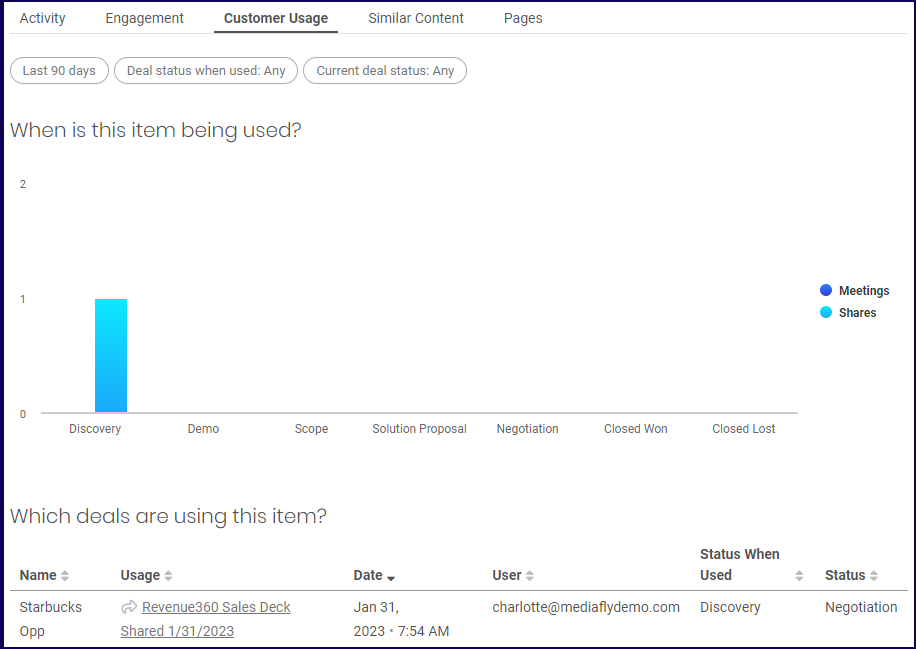
When is this item being used?
This section displays whether the items is being used on meetings or shares.
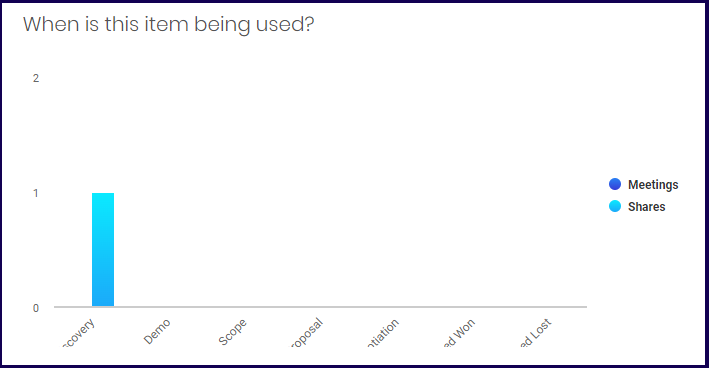
Note: When the mouse is hovering over one of the two metrics presented in the chart legend, the other metrics are lightened so that you can accurately view the selected metric. In the example below, the mouse is hovering over the Meeting stat and the Shares are lightened.
Which deals are using this item?
This displays what deals uses to item.
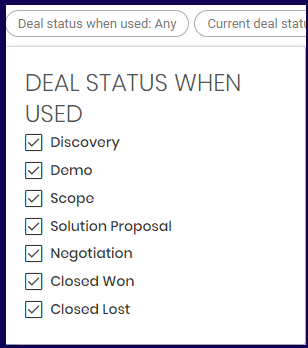
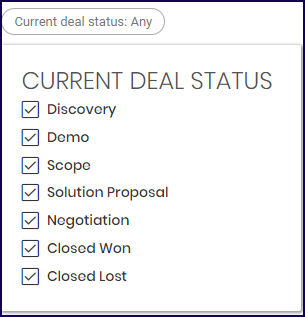
Filters
The Customer Usage tab uses two special filters for it's page.
-
Deal status when used
The Deal status when used allows you to select the deal status when the item was used.
-
Current deal status
The current deal status when used allows you to select the deal status when the item was used.
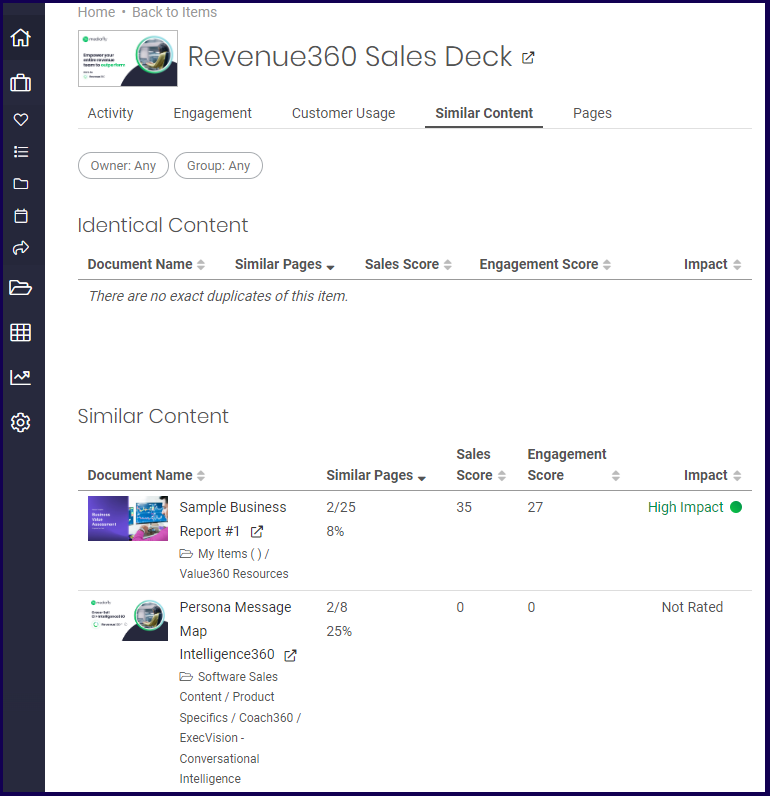
Similar Content
The Similar Content tab displays if the item has any identical content or similar content.
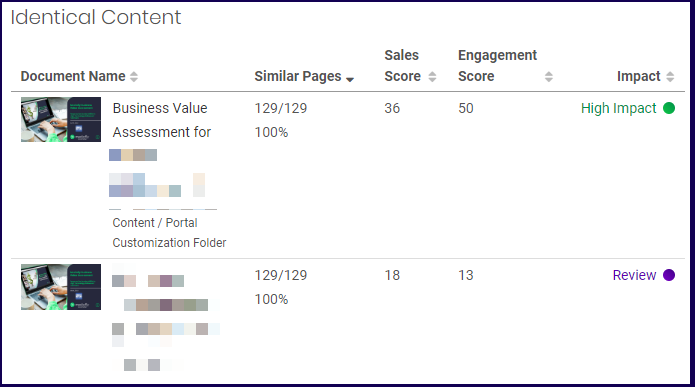
Identical Content
This section displays if the item has any other duplicates in the environment. In the example below, the item has been duplicated in the environment. Since the item is a duplicate the Similar pages display 100% unless the duplicated item is altered.
The list can be sorted by Document Name, Similar Pages, Sales Score, Engagement Score, and the Impact.
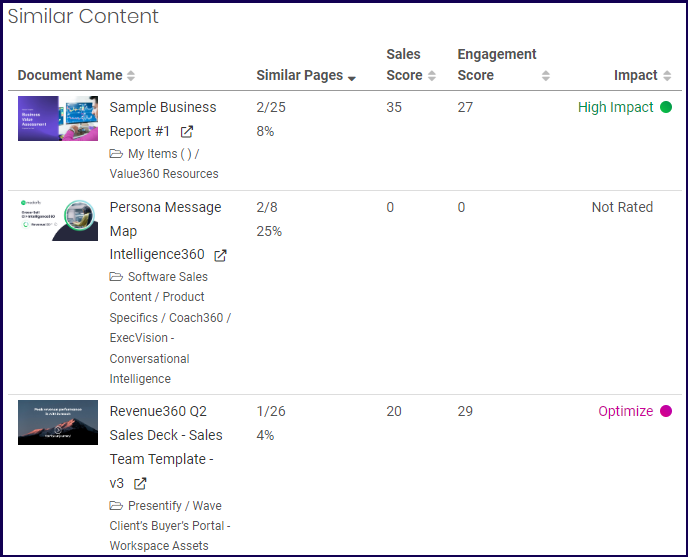
Similar Content
The similar content displays any items that have similar pages of the item with any other items. In the example below, the item has similar pages to other items and the number of pages and the percentage of the item is displayed there.
The list can be sorted by Document Name, Similar Pages, Sales Score, Engagement Score, and the Impact.
Pages Tab
The pages tab appears if the item is a presentation item or an image. This page display information about the number of views and the view time of each pages. The page tab has two sections, the 'Which pages are viewed the most?' section and the Pages section.
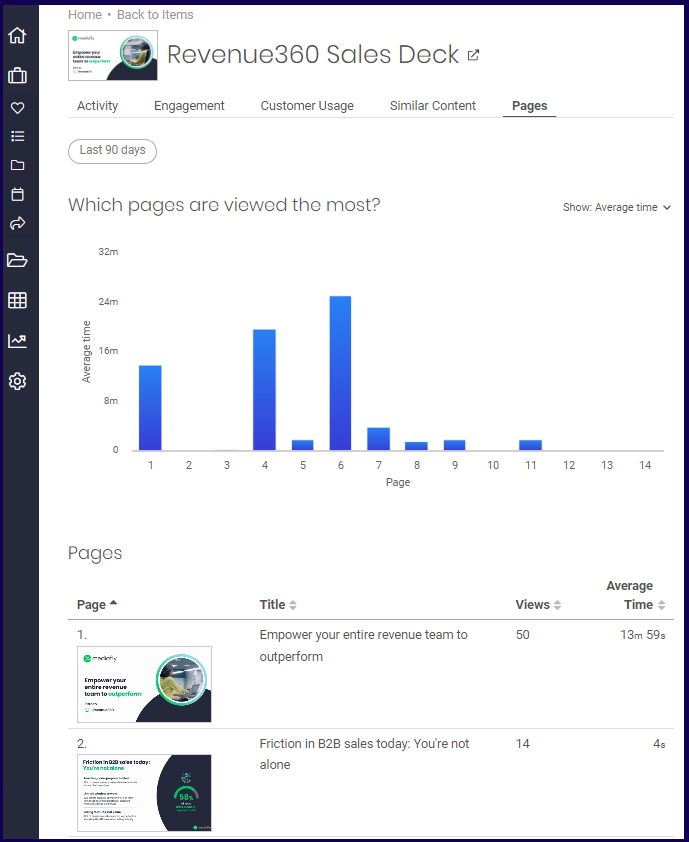
Which pages are viewed the most?
This section displays a chart of the pages of the item that has the most views on each pages or the average time users spend on each page.
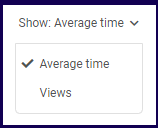
The show button allows users to switch from Average Time to Views to switch to these items.
Average Time:
Views:
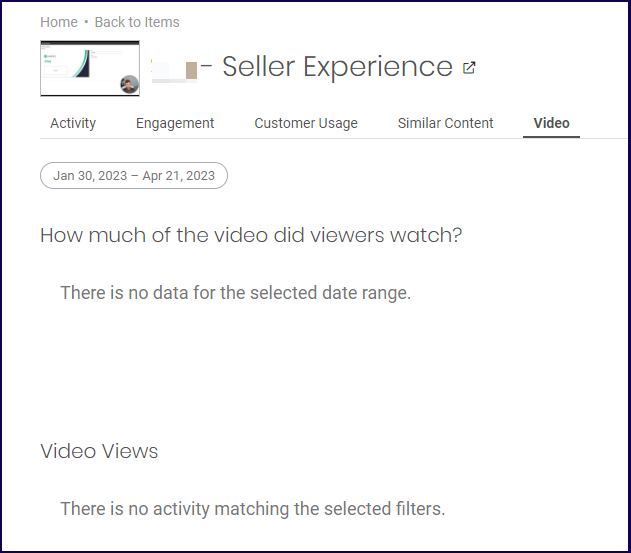
Video Tab
The video tab is displayed if the item is a video. The Video tab presents the 'How much of the video did viewers watch' and the Video views sections.
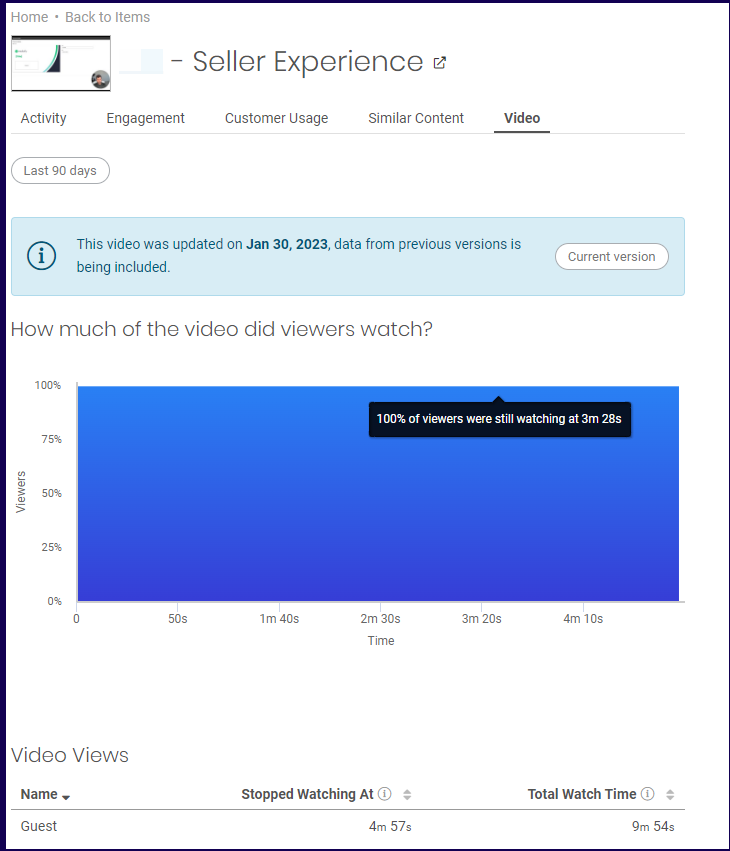
Note: If the video item has been updated numerous times, the data from the videos previous versions are included and displayed. Clicking on the Current version button switches the item to only display the data of the video from the date the item was updated.
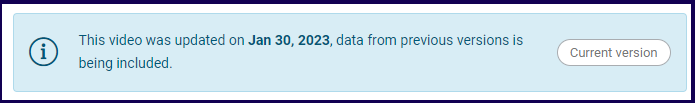
In the example below, the Current version is selected. The date range filter is automatically changed to display the data from Jan 30, 2023, which is the date when the video was updated.
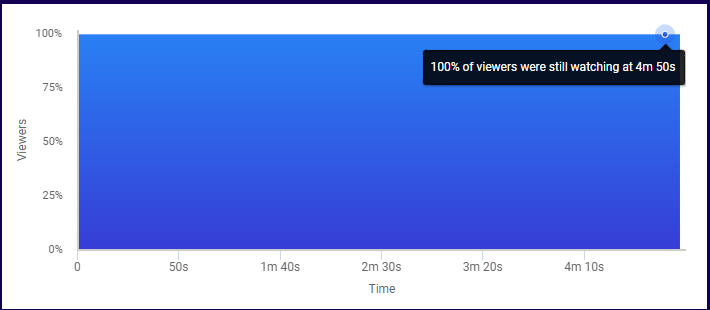
How much of the video did viewers watch?
This section displays the percentage of the video that was watched by the viewers. In the example below, 100% of the viewers of the item watched the video until the 4 m 50s time stamp.
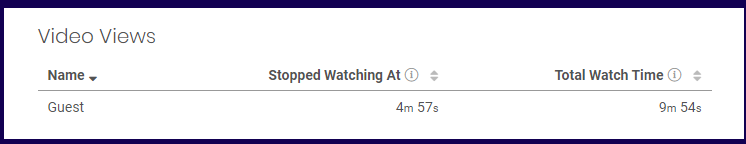
Video Views
The video views section displays how far into the video the guest watched, and the total watch time. In the example below, the viewer stopped watching on the 4 m 57s mark. But as the viewer reviewed or rewatched the video, the recorded total watch time of the viewer exceeds the time recorded in the Stopped Watching at column.
Views
View Reports display the stats of the items in the environment and sort them according to any order that you like. You can easily identify the most viewed, shared, or the items with the highest engagement or sales score.
All Views Report
The all views report display the views of all items in the environment.
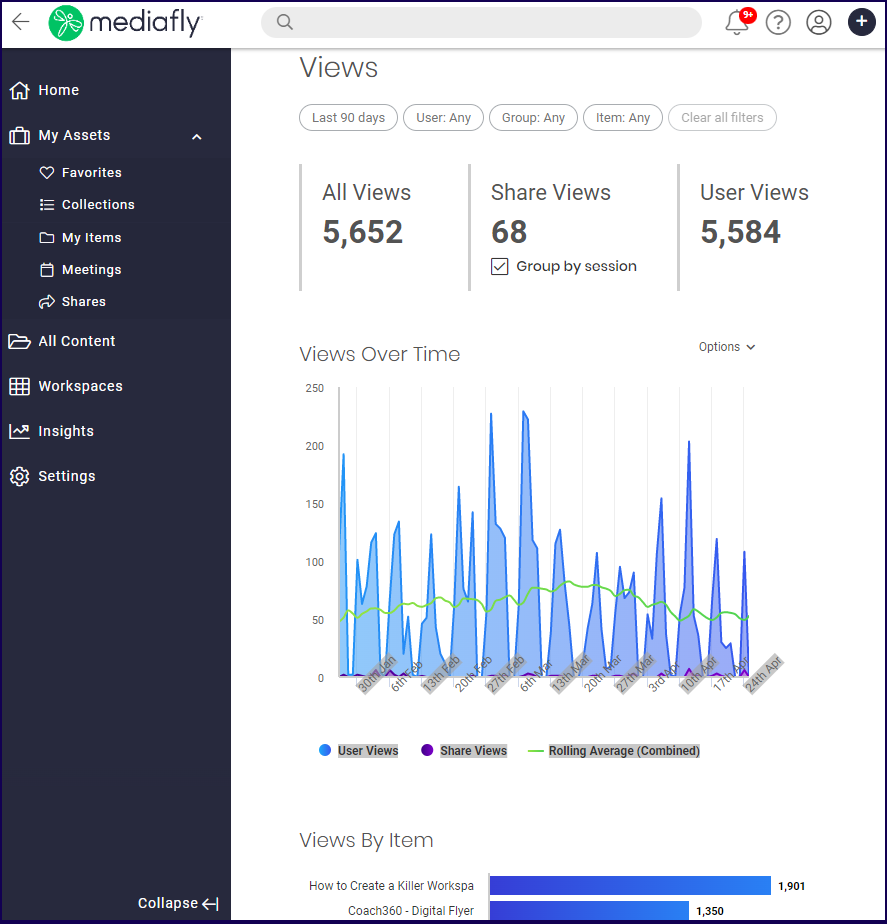
The All Views Report displays the following sections:
Summary
The summary sections displays three views stats: All views, Share Views, and User Views
- All views refer to all views (All Share Views + User Views) made in the environment.
- Share Views refer to to views made on items that have been shared.
- User Views refer to views made by internal users in the environment.
In the example above, the following interpretations is made per stat item:
- All Views- There are a total of 5,652 views in the environment for the last 90 days.
- Shares- There were 68 share views in the environment for the last 90 days.
Note: The Share Views stat displays the Group by session checkmark which allows you to change the displayed views to count views made in a single session as one. Refer to the Group by Session discussion for more information on the Group by Session button. - Share Views- There were 5,584 total user views in the environment for the last 90 days.
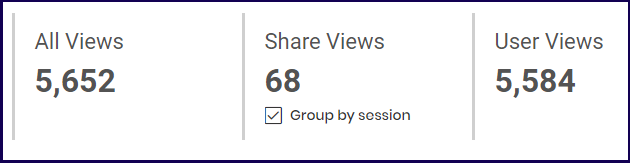
Views Over Time
The views over time displays the views made on the item. Three stats are shown as it's default. The User Views, the Share Views, and the Rolling Average, which is the combined view stats of User Views and Share Views.
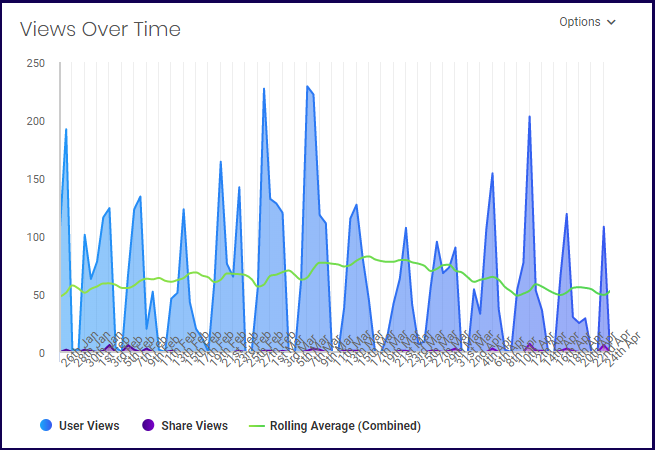
Note: When the mouse is hovering over one of the three metrics presented in the chart legend, the other metrics are lightened so that you can accurately view the selected metric. In the example below, the mouse is hovering over the Rolling Average stat and the User Views and Share Views are lightened highlighting the Rolling Average line graph.
The Options button allows you to alternate the views to different stats. To change the data shown on the chart, click on the options button.
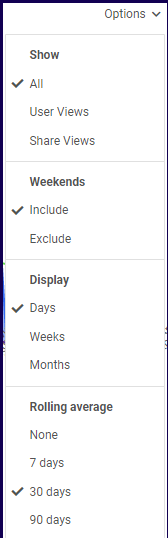
The options button allows you to change the displayed data in the chart with the following settings:
- Show - This section allows you to set which view data you want shown in the chart. Selecting either User Views and Share Views, changes the Rolling Average as the other metric is not included.
- Weekends - Depending on the accounts preference, users may switch the chart to include or exclude view metrics on weekends.
- Display - This allows you to set if the chart is to show a daily, weekly, or monthly that is displayed on the site.
-
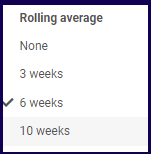
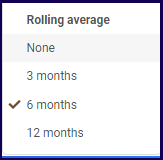
Rolling Average - This allows you to change the range of the rolling average of the chart.
Note: The Rolling Average changes its options depending on the marked item in Display. In the examples below, the selected option in Display is Weeks and Months respectively.
Views By Item
The Views by Item section list the views recorded in the environment according to the most viewed item first. Share views are also displayed alongside user views.
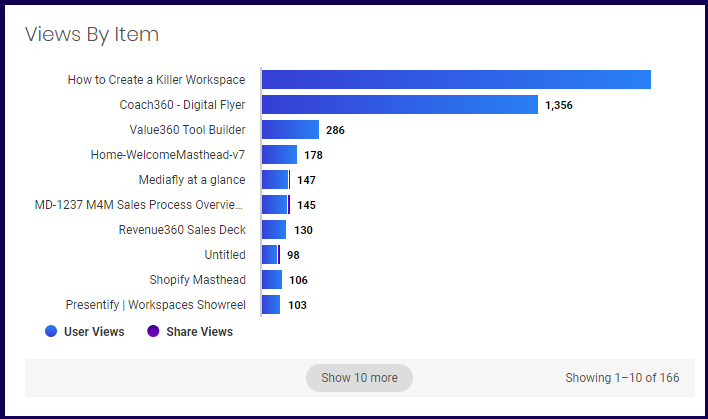
Note: When the mouse is hovering over one of the two metrics presented in the chart legend, the other metrics are greyed out so that you can accurately view the selected metric. In the example below, the Rolling Average is selected.
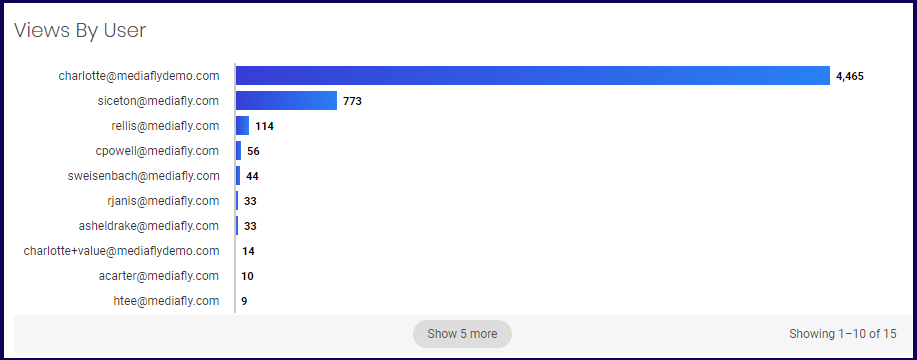
Views By User
The Views by User section sorts the views in the environment by the user who preforms the views. The user with the most view activity is displayed first.
Users
The User Reports display the list of users and compiles a report of regarding the activity of the user.
The user activity this report displays is as follows:
- The total generated views relating to the shares, workspaces and created items of the user
- The number of meetings the user initiated.
- The number of shared items the user made.
- The number of workspace created.
- The number of items created.
- The last activity of the user.
- The total number of activity the user did.
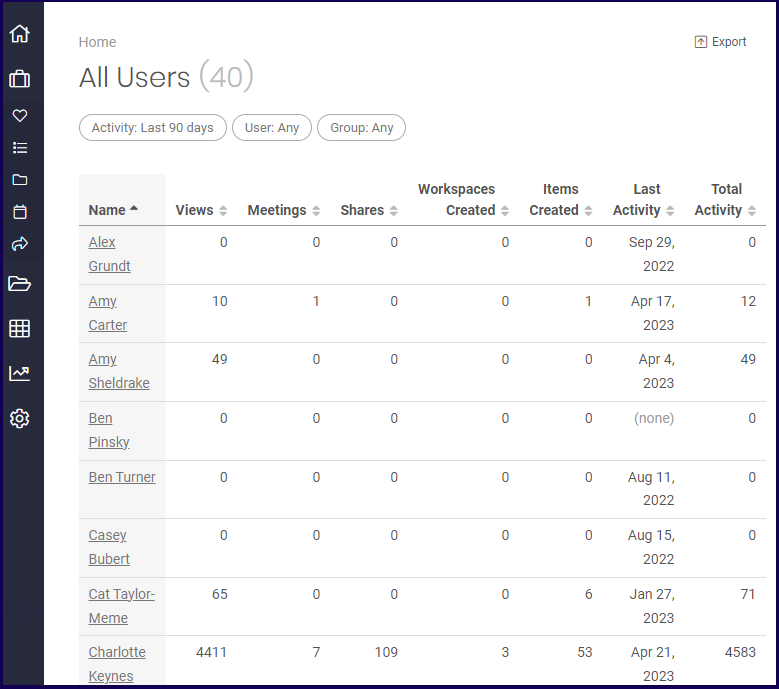
Use the sorting row to rearrange the order of the displayed user stats.

Clicking on a user displays the User Detail page.
User Detail
The user detail page displays a users activities, statistics and other details. The User detail page has three tabs.
The User Detail page displays the following tabs:
Activity Tab
The activity tab displays three sections that display the details of the users actions.
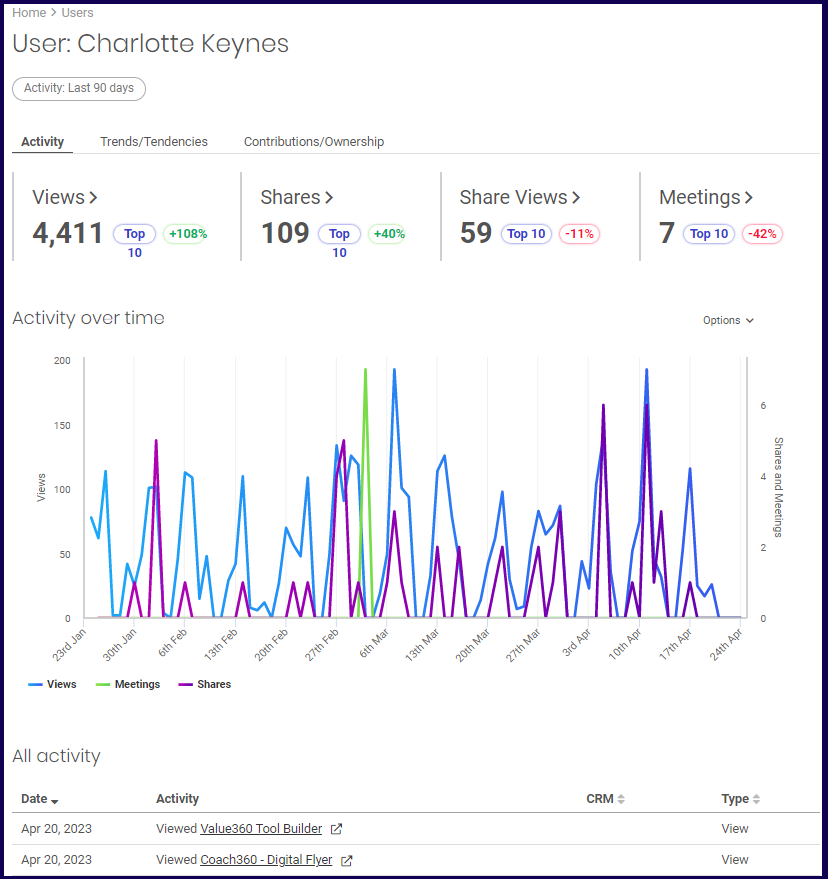
Summary Section
The summary sections displays four user stats: the views, shares, share views, and meetings.
- Views- refer to the number of views the selected user has made.
- Share- refers to the number of shares the selected user has created.
- Share Views- Refers to the number of views that the selected user made on all shared links within the environment.
- Meetings- Refers to the number of times the the selected user initiated a meeting.
Each item displays the number instances of each stat. After each stat record, a percentage change is displayed next to it to indicate if there is a positive increase or decrease in number when compared to the previous period.
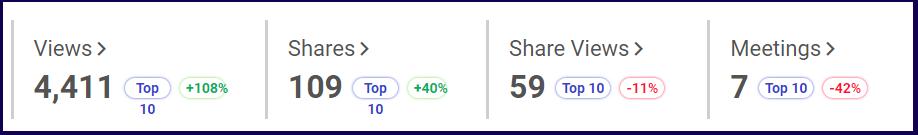
In the example above, the following interpretations is made per stat item:
- Views- The selected user made 4,411 views made on items, workspaces, and shares. The selected user is within the top 10 of most views. There has been a 108% increase of views in the last 90 days compared to the previous 90 day period. Clicking on this opens the Views Report and automatically adds this user to the filter of the View reports.
- Shares- There were 109 shares of an item created by the selected user. The selected user is within the top 10 of most views. There has been a 40% increase of shares in the last 90 days compared to the previous 90 day period. Clicking on this opens the Shares Report and automatically adds this user to the filter of the Shares reports.
- Share Views- There were 59 total share views made on items created by the selected use. The selected user is within the top 10 of most share views. There has been a 11% decrease of shares views in the last 90 days compared to the previous 90 day period. Clicking on this opens the Share Report and automatically adds this user to the filter of the Share reports.
- Meetings- There were 7 Meetings initiated by the user. The selected user is within the top 10 of most views. There has been a 42% decrease of initiated meeting meetings in the last 90 days compared to the previous 90 day period. Clicking on this opens the Meetings Report and automatically adds this user to the filter of the Meetings reports.
Activity over Time Section
The activity over Time section displays a chart of the activity of the user within a time period.
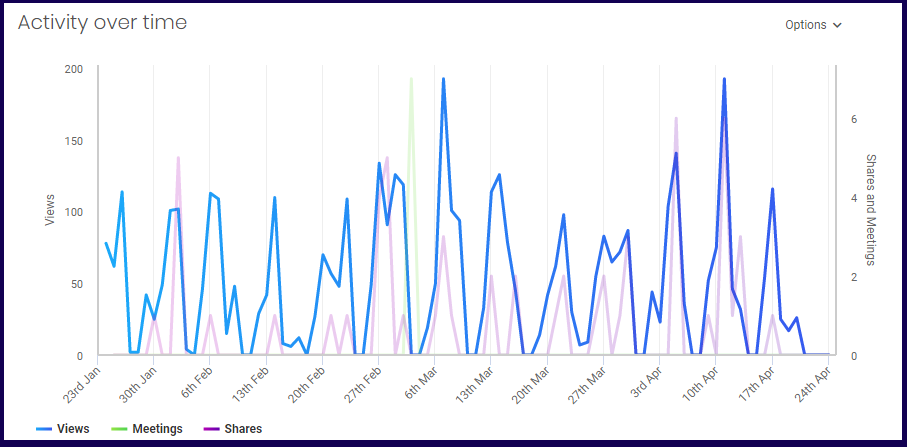
Note: When the mouse is hovering over one of the three metrics presented in the chart legend, the other metrics are lightened so that you can accurately view the selected metric. In the example below, the mouse is hovering over the Share stat and the User Views and Share Views are lightened highlighting the Shares graph.
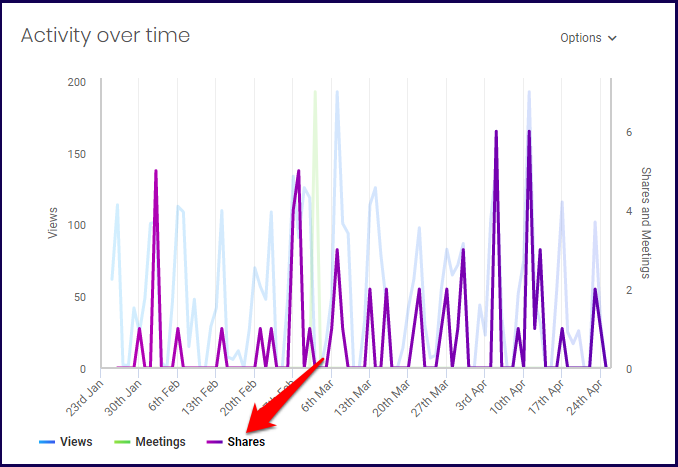
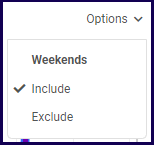
Depending on the accounts preference, users may switch the activity chart to include or exclude weekends in the chart using the options dropdown button.
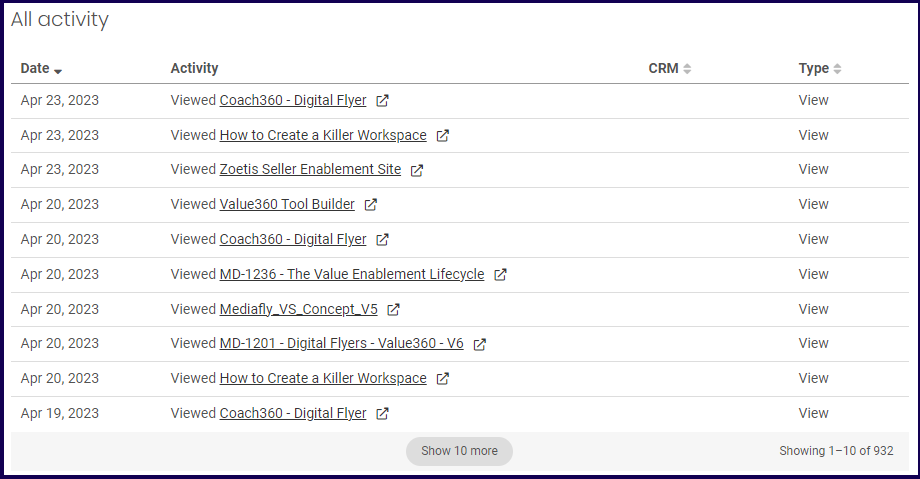
All Activity Section
The all activity section list the activities that the selected user performed. Use the rows to sort the displayed list.
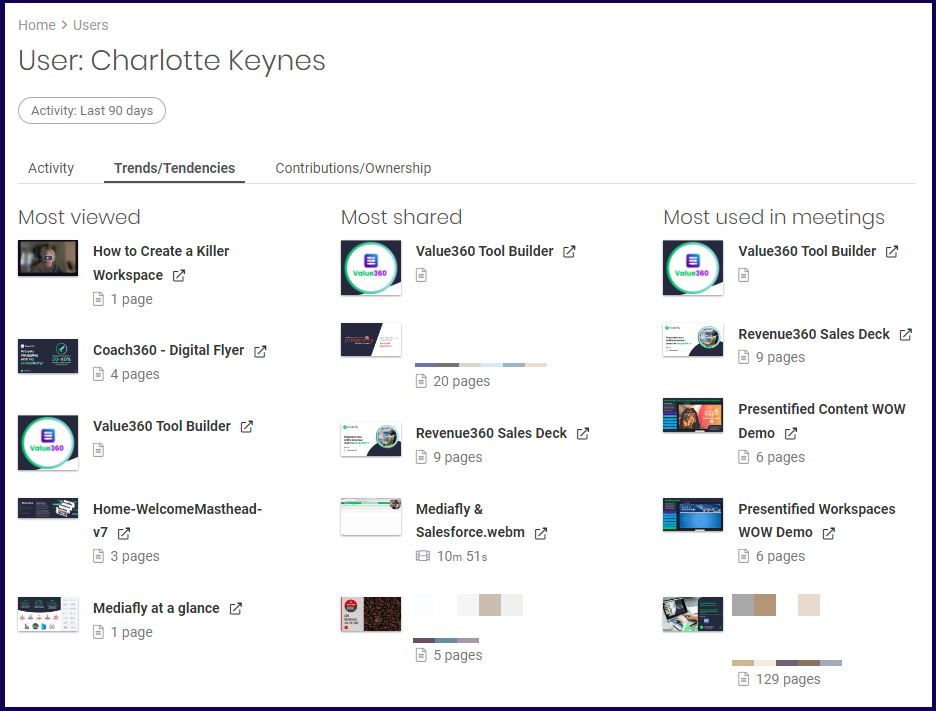
Trends/Tendencies
The Trends/Tendencies tab displays the selected users most viewed items, most shared items, and the items most used in meetings.
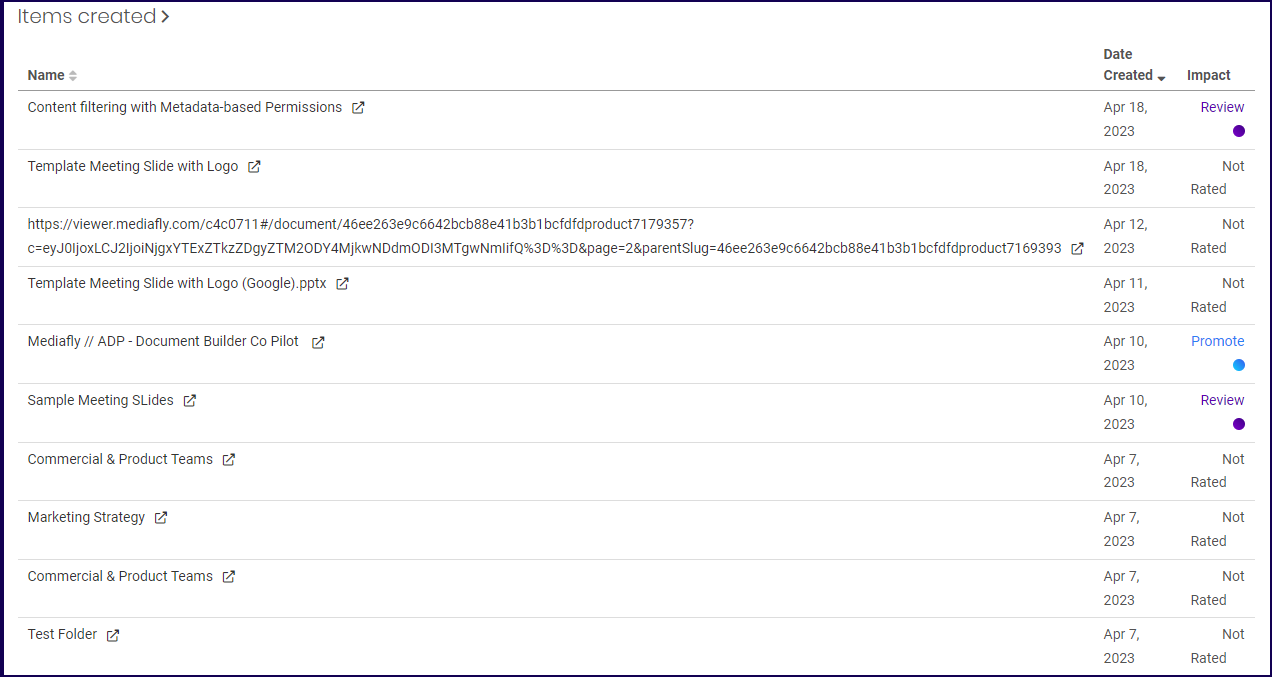
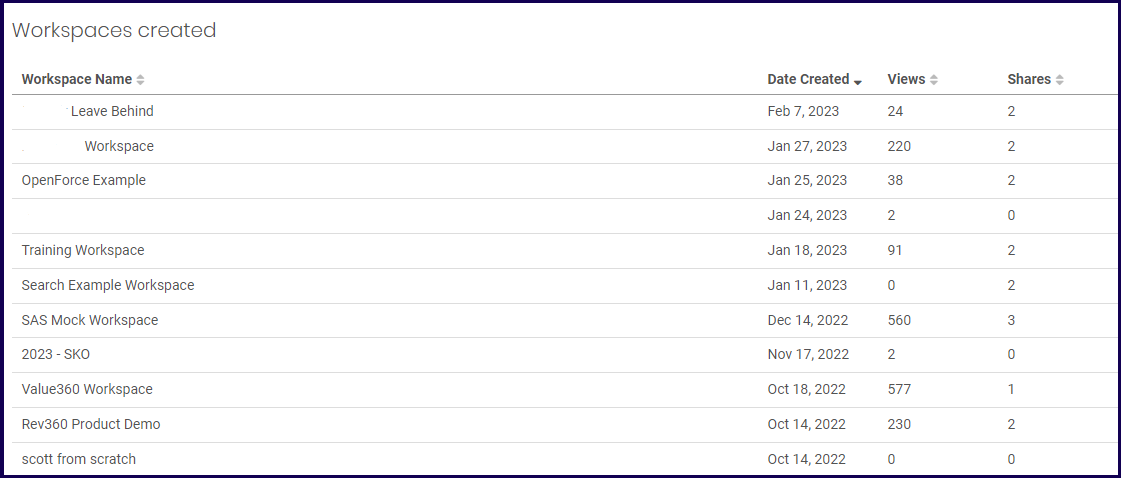
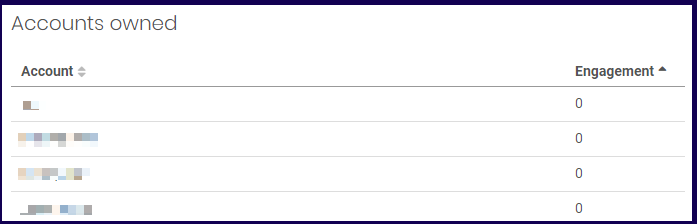
Contributions/Ownership
This tab displays three sections:
- Items Created
- Workspace Created
- Accounts Owned
Items Created
The Items Created section displays all the items created by the selected user.
Workspace Created
The Workspace Created section displays all the workspaces the selected user created.
Accounts Owned
The accounts owned section displays the accounts that is being owned by the user.
Note: Clicking an account opens the Account Engagement report and displays the detail of the clicked account. Refer to the Account Engagement documentation for more information about account.
User Groups
The User Groups report list the activity of all users and sorts them by group. This allows you to see the views, shares, and other activities of each group. Clicking on the groups will open the User Group detail.
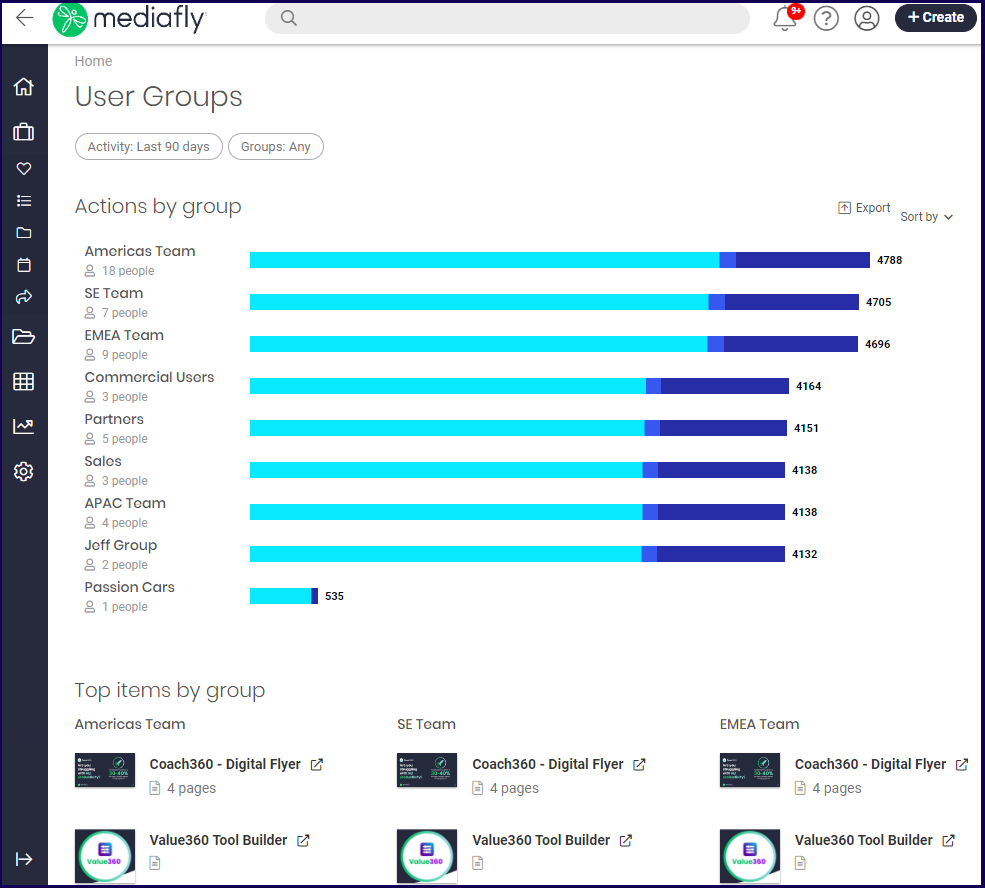
The User Groups page displays the following sections:
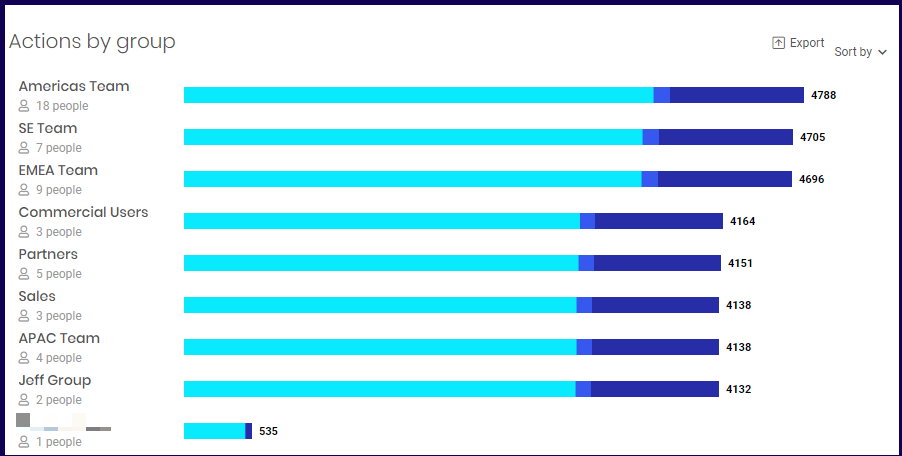
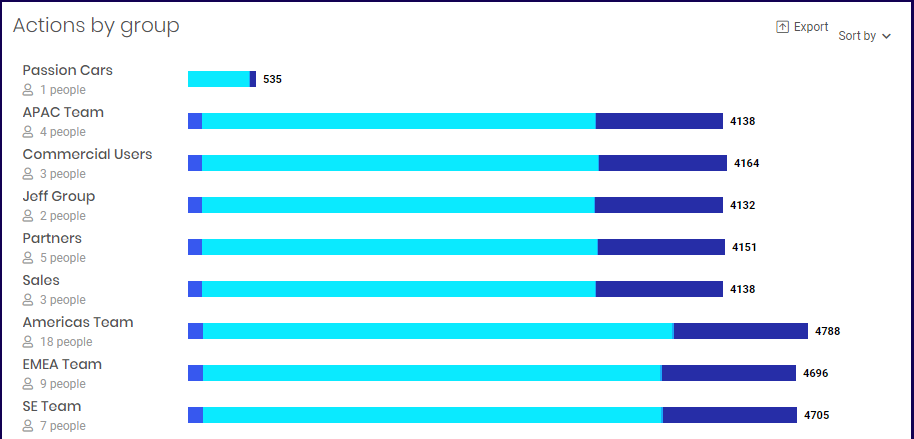
Actions by Group
The actions by group chart allows you to see the statistics of each group based on their activities. The default report displays views, shares, share views, and meetings.
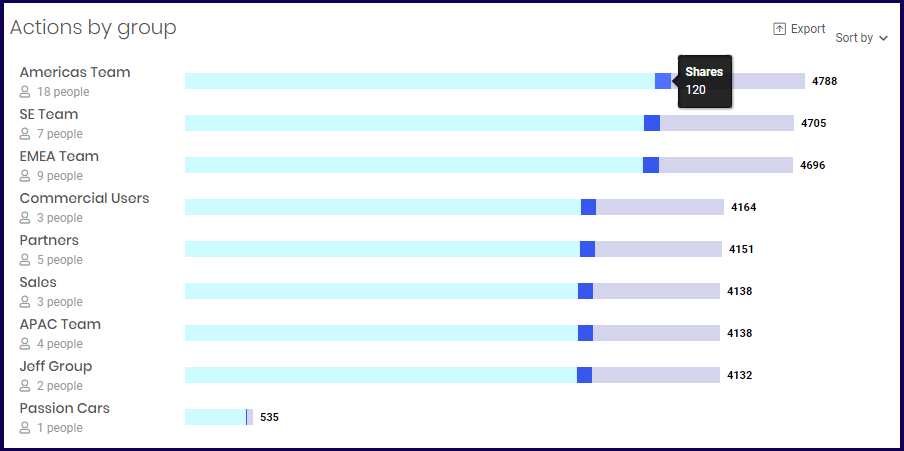
Hovering your mouse to over one of the 'colors' in the chart will highlight the color and lighten the other activities. In the example below, the Shares is highlighted.
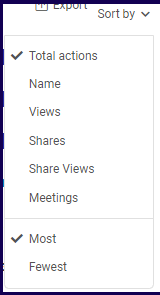
The Sort by button allows you to sort the report according to the group actions.
The following sorting options may be selected:
- Total actions- This is used to sort the actions according to the total actions of the groups which includes views, shares, share views, and meetings.
- Name- This is used to sort the name of the groups alphabetically.
- Views- This is used to sort the actions of the report according to the number of views. If selected, the Views color is moved to the leftmost side of the chart.
- Shares- This is used to sort the actions of the report according to the number of shares. If selected, the Share color is moved to the leftmost side of the chart.
- Share Views- This is used to sort the actions of the report according to the number of share views. If selected, the Share View color is moved to the leftmost side of the chart.
- Meetings- This is used to sort the actions of the report according to the number of meetings. If selected, the Meetings color is moved to the leftmost side of the chart.
Aside from selecting any sorting options, you can sort the report to display which groups had the most or fewest actions first.
Note: The selected sorting options changes the list of items displayed on the Top Items by Group section. Refer to the succeeding discussion for more information.
In the example below, the Shares sorting option is selected and the selected order is by fewest. The groups with the least shares are displayed first, and the order of actions uses Shares as the first block.
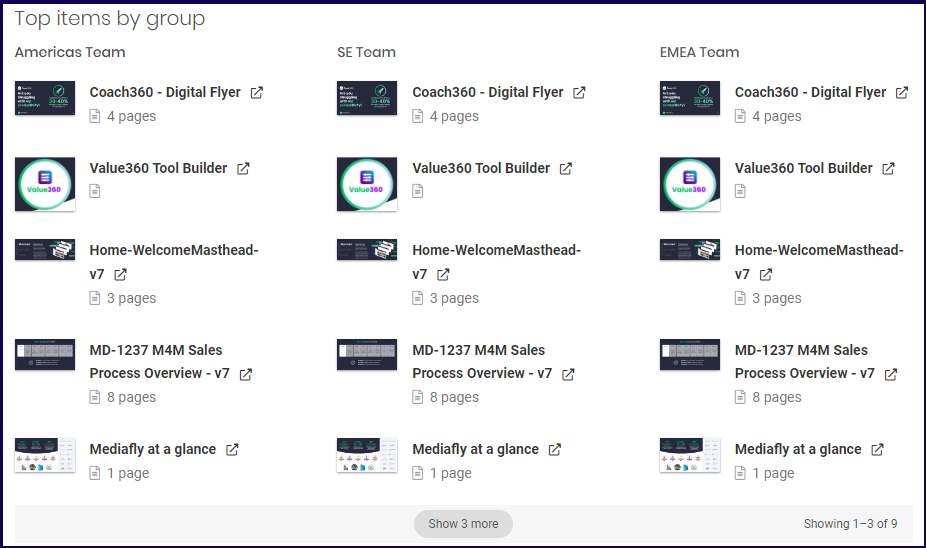
Top Items by Group
The Top Items section lists the top items that each group has. Depending on the selected option marked in the sort by button in the Actions by Group section, the order of the groups being displayed will change to match the order shown in the Actions by Group section.
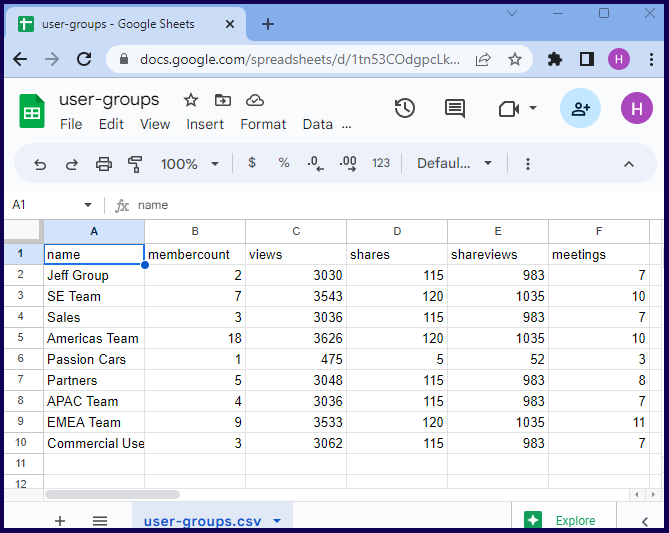
Exporting a User Group Report
An export button is provided to export the current report into a .csv file.
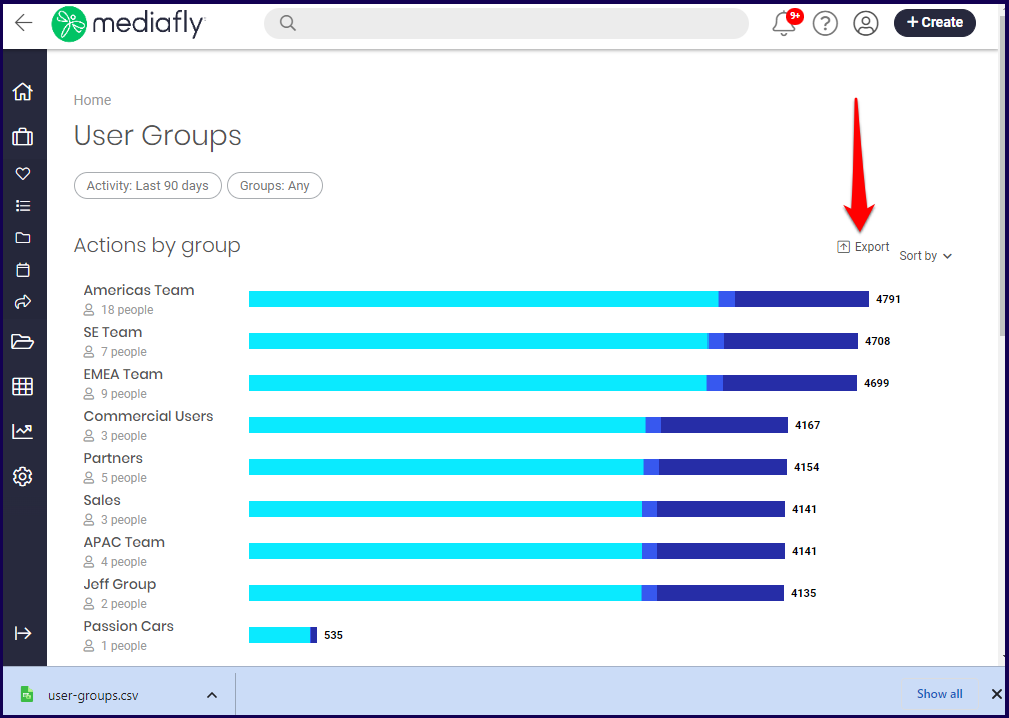
In this example, the downloaded item-stats.csv file of the above report is opened in Google Sheets below.
User Group Details
If a user group is selected, the User Group details of the selected user groups will appear. The activity of the group is displayed in detail.
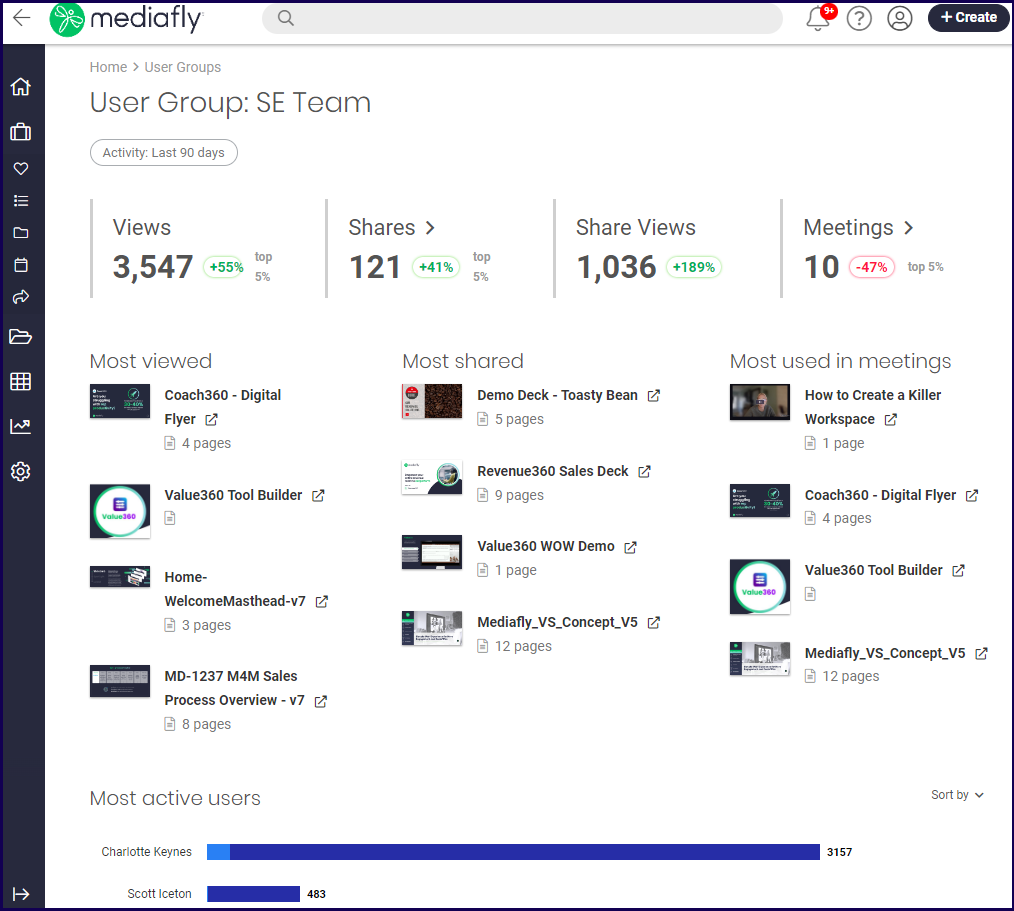
The User Group details page provides the following sections:
Summary Section
The summary sections displays four user stats: the views, shares, share views, and meetings.
- Views- refer to the number of views the members of the selected user group made.
- Share- refers to the number of shares the members of the selected user group created.
- Share Views- Refers to the number of views that the members of the selected user group made on all shared links within the environment.
- Meetings- Refers to the number of times the the members of the selected user group initiated a meeting.
Each item displays the number instances of each stat. After each stat record, a percentage change is displayed next to it to indicate if there is a positive increase or decrease in number when compared to the previous period.
In the example above, the following interpretations is made per stat item:
- Views- The groups users have initiated 3547 views and there has been a 55% increase of views that the users in the group did in the last 90 days compared to the previous 90 day period. The users in this group belong to the top 5% of users that views items in the environment.
- Shares- The groups users have initiated 121 shares and there has been a 41% increase of views that the users in the group did in the last 90 days compared to the previous 90 day period. The users in this group belong to the top 5% of users that share items in the environment. Clicking on this opens the Shares Report and automatically adds this User group to the filter of the Shares reports.
- Share Views- There were 1036 total share views made and there has been a 189% increase of shares views in the last 90 days compared to the previous 90 day period. Clicking on this opens the Shares Report and automatically adds this User group to the filter of the Shares reports.
- Meetings- There were 10 Meetings that the users of this group initiated and there has been an 47% decrease in the meetings in the last 90 days compared to the previous 90 day period. The users in this group belong to the top 5% of users that initiate meetings in the environment. Clicking on this opens the Meetings Report and automatically adds this User group to the filter of the Meetings reports.
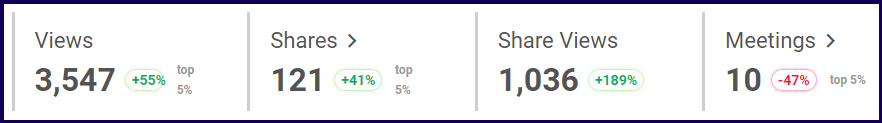
Top Items
This section displays the items that are most used by the members of the group. Three sections are presented to display the items most used for specific activities.
The list displays the Most Viewed item, the Most Shared, and Most used in Meetings.
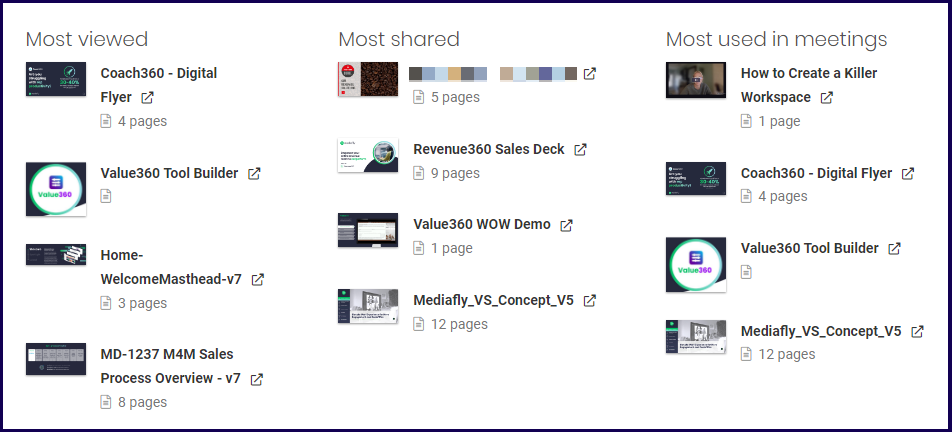
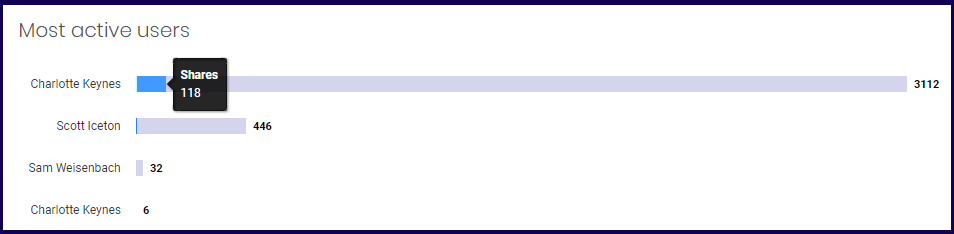
Most Active Users
This section displays the most active users within the group.
Hovering your mouse to over one of the 'colors' in the chart will highlight the color and lighten the other activities. In the example below, the Shares is highlighted.
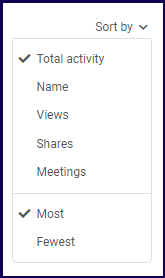
The Sort by button allows you to sort the report according to the users activities.
The following sorting options may be selected:
- Total actions- This is used to sort the actions according to the total actions of the groups which includes views, shares, share views, and meetings.
- Name- This is used to sort the name of the groups alphabetically.
- Views- This is used to sort the actions of the report according to the number of views. If selected, the Views color is moved to the leftmost side of the chart.
- Shares- This is used to sort the actions of the report according to the number of shares. If selected, the Share color is moved to the leftmost side of the chart.
- Share Views- This is used to sort the actions of the report according to the number of share views. If selected, the Share View color is moved to the leftmost side of the chart.
- Meetings- This is used to sort the actions of the report according to the number of meetings. If selected, the Meetings color is moved to the leftmost side of the chart.
Aside from selecting any sorting options, you can sort the report to display which groups had the most or fewest actions first.
Replies have been locked on this page!