
🔐 Admin Only 🔐
Reports are admin created, customizable content and visualizations that are a great tool for inspecting both high-level and detailed data, but their adaptability takes them from great to imperative. Creating new reports lets you decide exactly which data to display and how.
Once a report is created by an admin, other members of your team can view the individual report or use them as base reports by adding them as interactive cards to dashboards. These reports are now both powerful tools for inspection and common, adjustable data sets available to your team.
Jump to:
Creating Reports
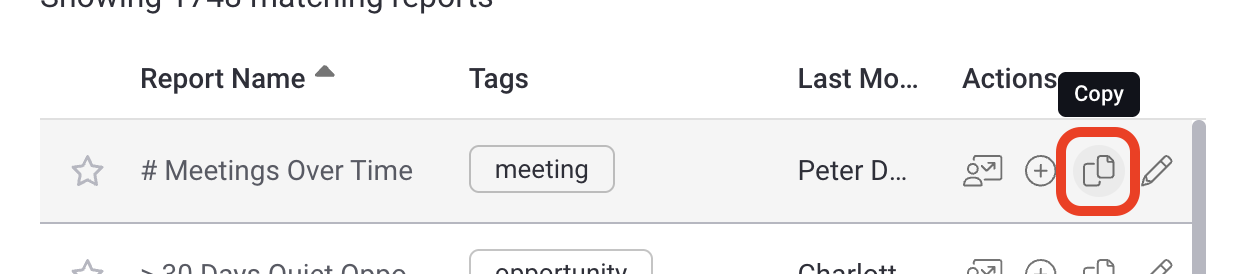
Intelligence provides common reports right out of the box, or you can create net new reports from scratch. Our recommended best practice is to find an existing report that's close to what you want to create, copying that report and editing it to match your exact specifications...saving you time and effort. Here we'll walk through creating both net new and copy/edit reports.
-
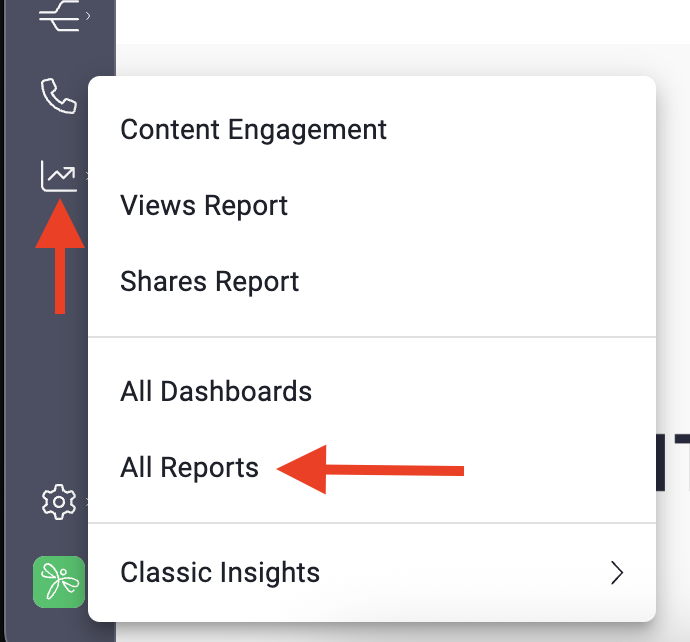
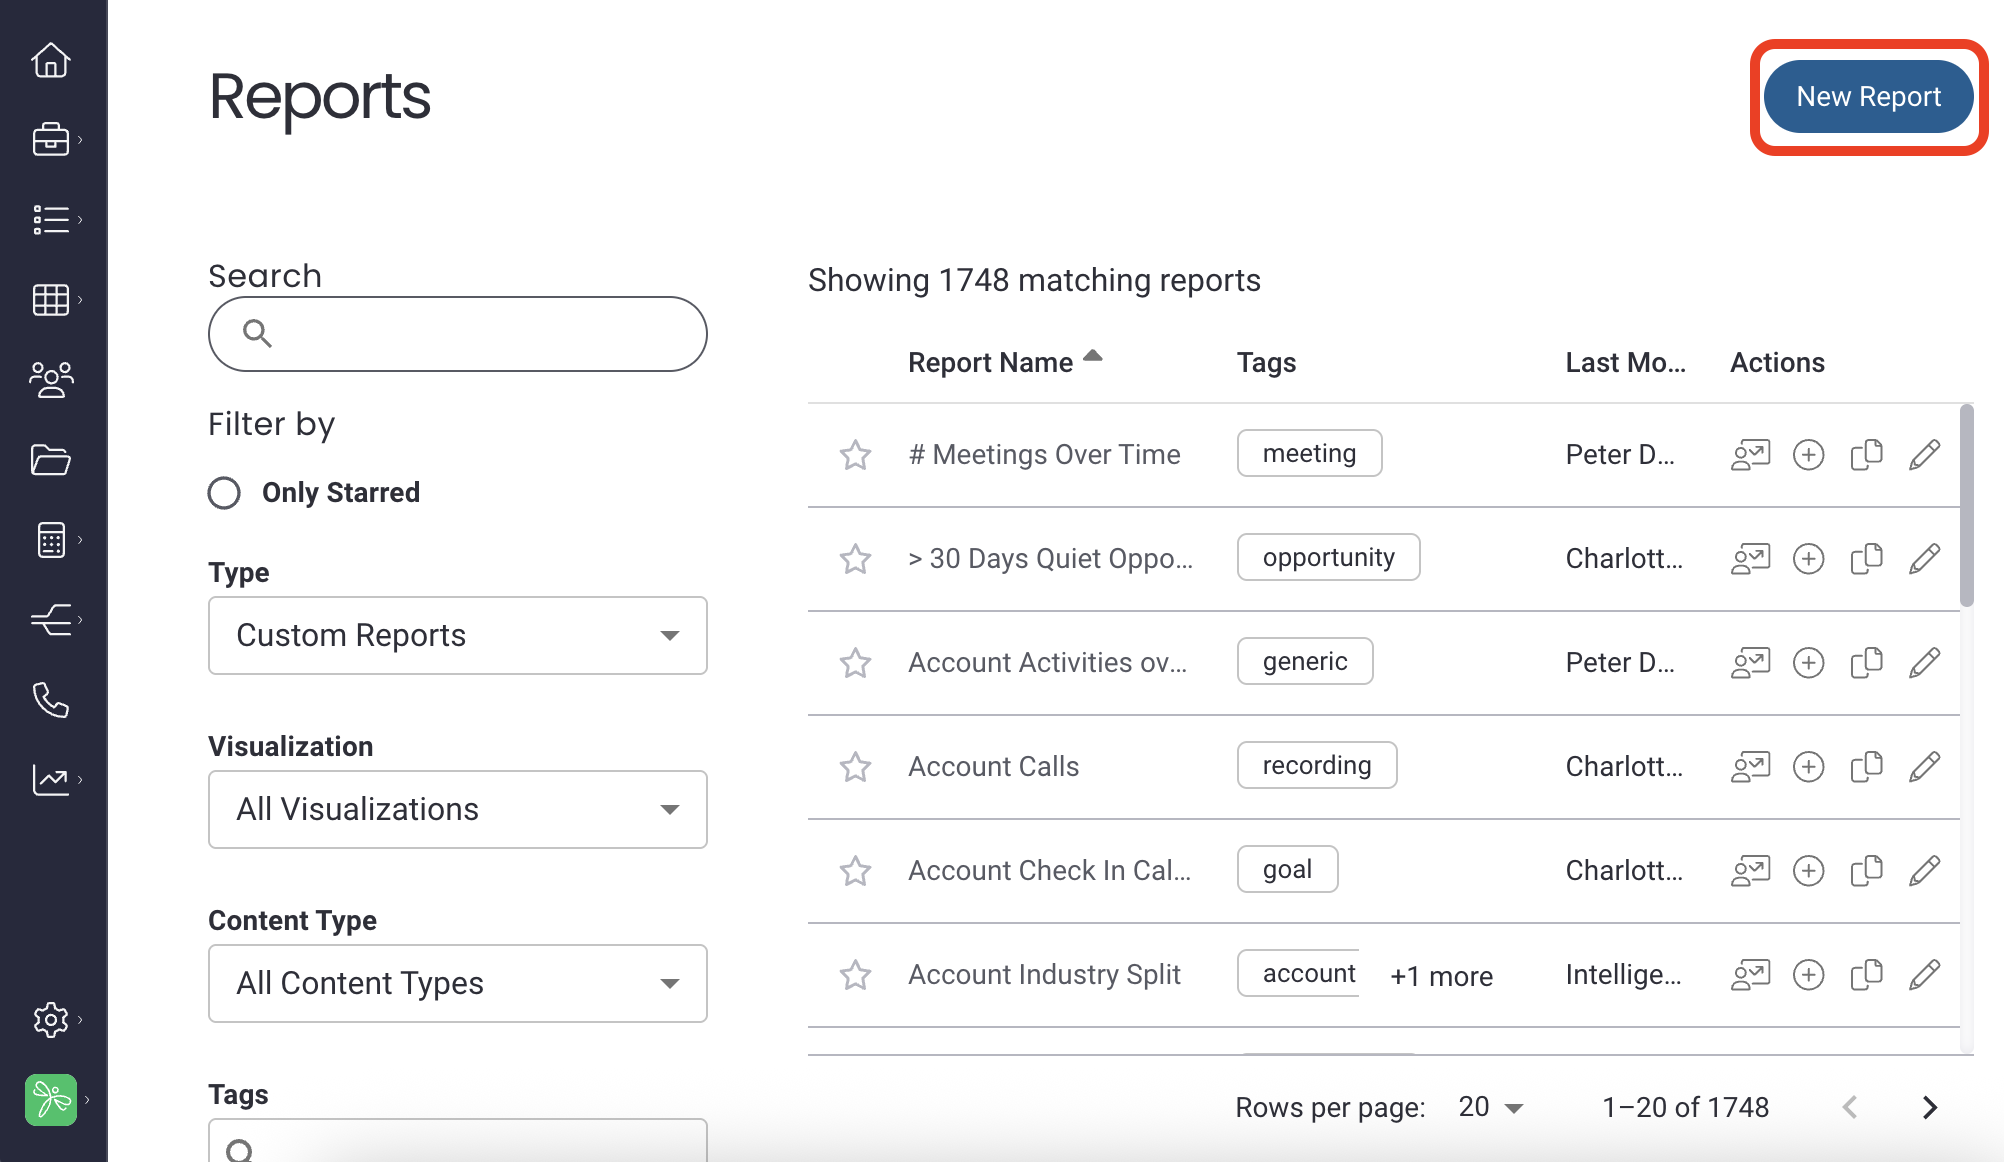
Go to the Reports page (Insights > All Reports)
-
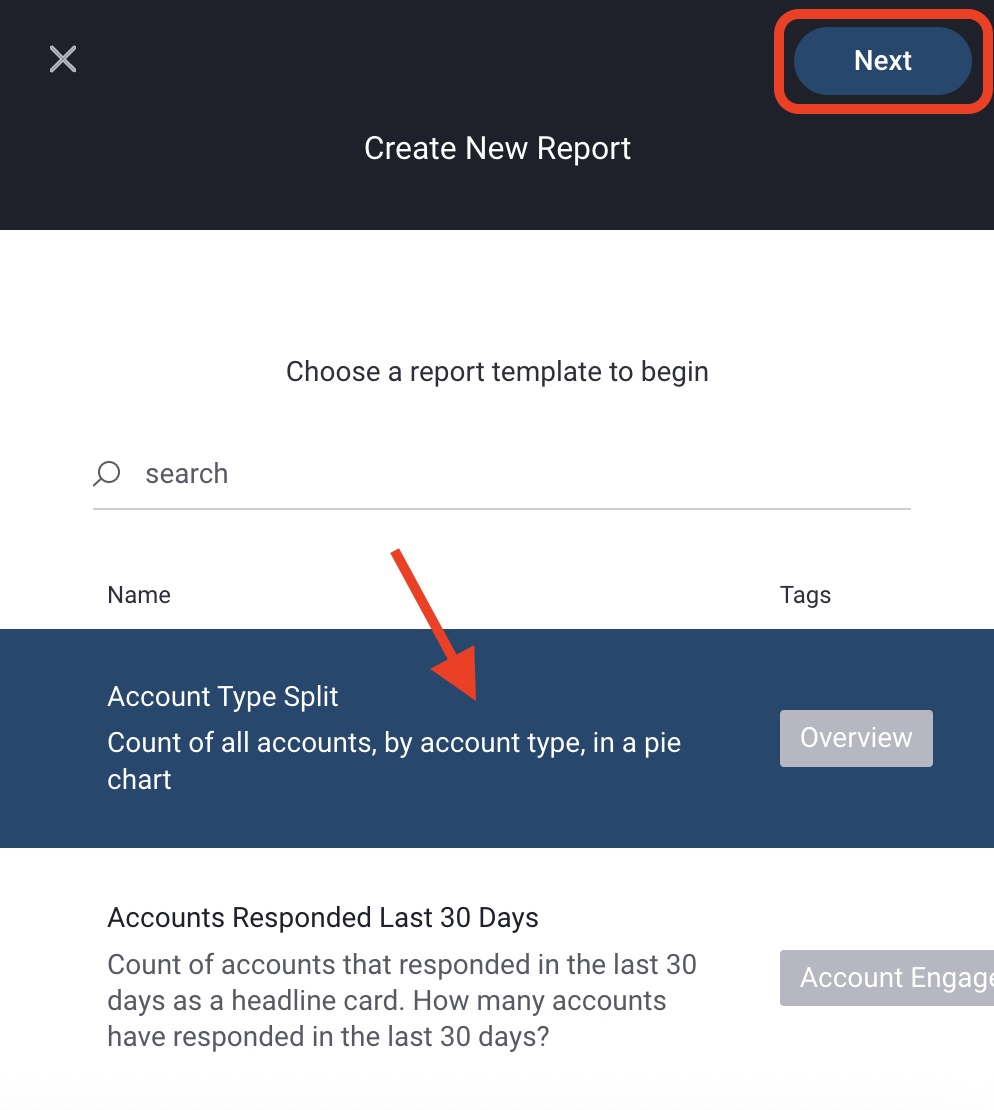
Select a template
Select a template with a content type most consistent with the content you want to be reflected in the card, click Next
-
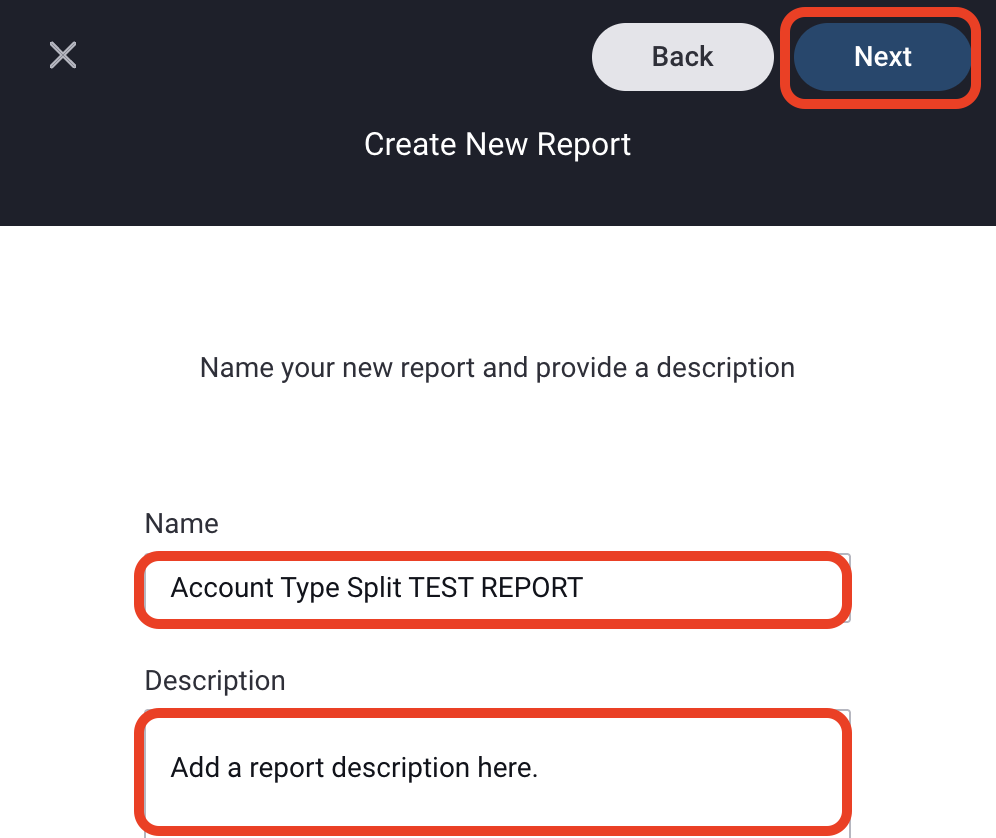
Name & Description
Name your new card and give it a brief description. Both the name and description will be visible in the Card Definition Management list making it easy to understand each card's purpose for future use. Click Next.
-
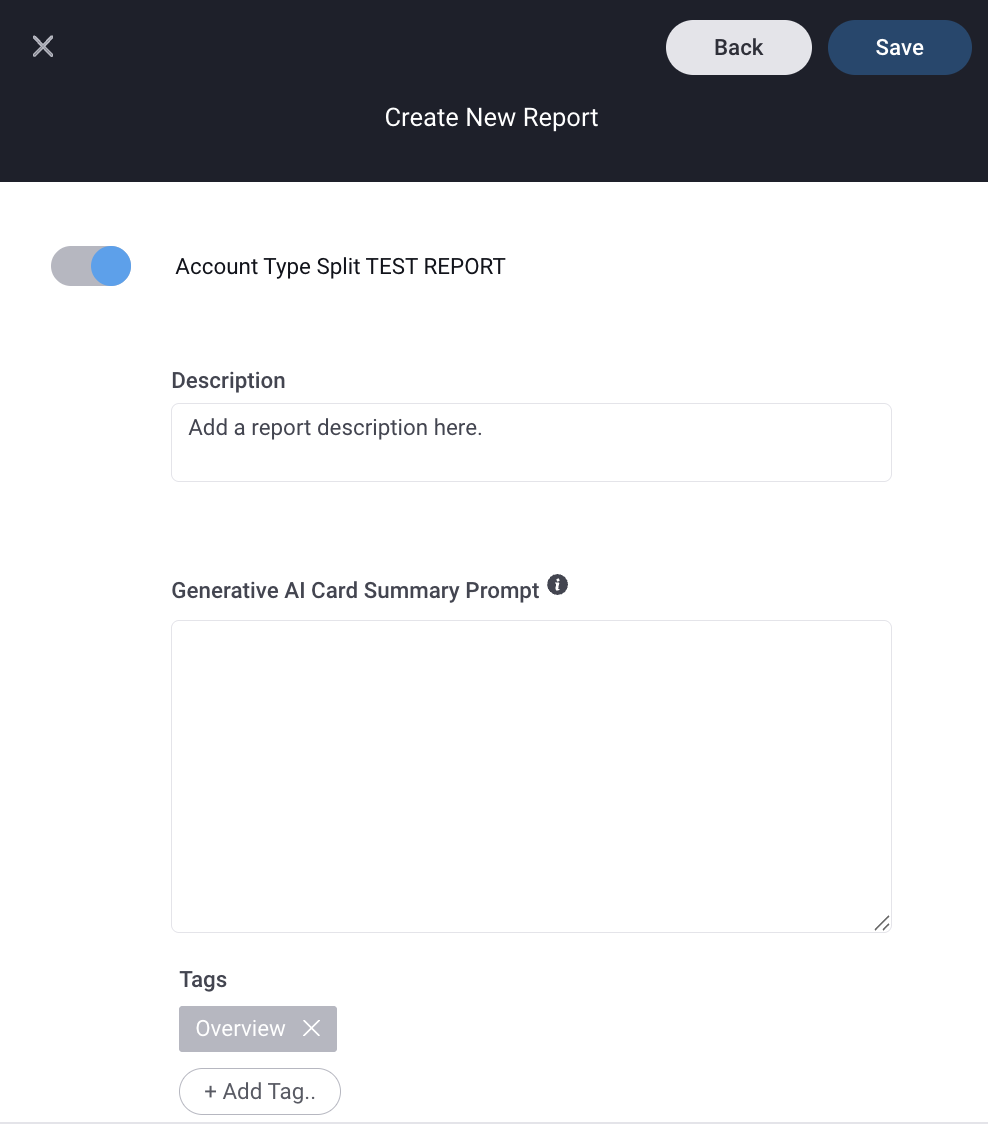
Enable Report / Add Tags
Now you're in the report editor! This section allows you to enable/disable the report from being available to you & your team, update the description, add a Generative AI Card Summary Prompt, and to add tags that will improve the report's searchability.
The following steps Define the content you want included in this report -
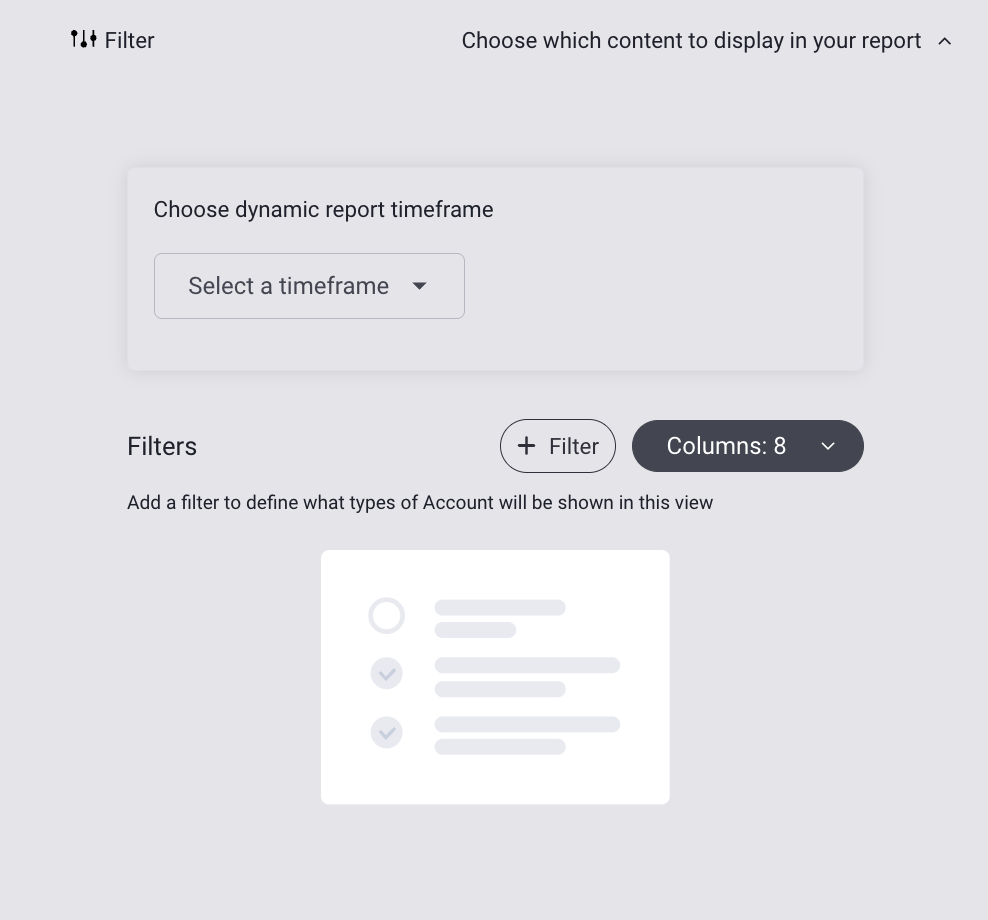
Filters / Columns
Filters
Choose a dynamic report timeframe (this will be the default, but adjustable when viewing the report) and what data is filtered and presented in your report. Different filters will be populated based on Content Type, and each different filter will present the corresponding metrics. Click the + to add filters.
Best Practice: Since Reports are created to act as base reports for interactive cards on dashboards, we recommend creating reports with the most basic data necessary to convey what you want from the report. This way, you and your team can add it to cards as is and adjust as necessary. For example, creating a Report for Pipeline Closing by Rep without adding a time filter allows you and your team to add this card to a dashboard and adjust the time frame on the card to fit their need in that moment, so you can have one report that supports Pipeline Closing this week/this month/this quarter/this year by Rep cards. That's one report that can return four different time frame cards; build it once, use it endlessly!
Columns
Click on the Columns dropdown menu to select which data points you want included as a column in this report. Click the eye icon to show (open eye) or hide (eye with slash) data. Anything that was added as a filter will automatically be shown as a column, but you can hide it.
-
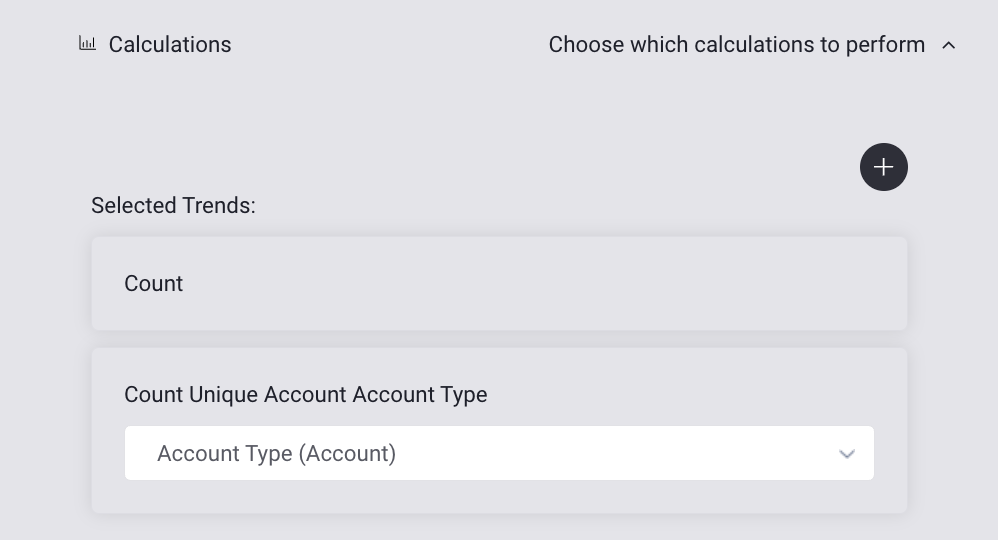
Calculation
Define what data to calculate and how. Add a calculation by clicking on the + button and choosing the type of calculation metric to be performed (average, sum, count). This is the type of calculation that will be performed.
Choose a property from the dropdown list to define what data will be calculated.
-
Visualization
Choose how your content is presented. There are several types of visualizations and each has its own requirements. Open this article and select your desired visualization to complete the Visualization portion of the report builder.
-
Save
Once completed, click Save. You have created a report! This report will now be available on the Reports page.
Editing Reports
Didn't create the perfect report on your first try? Did your needs change? Editing reports is as easy as finding the report on the Reports page and clicking the pencil icon to open the report editor, then refer to the steps 4-8 above to edit. Keep in mind that only admin with edit access to the report can do this.
Deleting a Report
Find a card no longer useful? You can delete it, but do so with 🚨CAUTION🚨.
Deleting a report deletes it everywhere. It will no longer exist in this universe or any other. It will be deleted from the report list, all cards that used this as a base report will be deleted so make sure you're not sending a card someone else is still using into the Great Abyss. I repeat: Delete. With. Caution.
-
Click the pencil icon either with the report open or inline with the report on the reports page.
-
Click delete. You will receive a warning ask if you're sure you want to delete the report.
-
Click yes to proceed or cancel to return to the editor.
Replies have been locked on this page!