
Overview
Generating reports is one of the backbones of the Value application. Not only does it allow you easily send a value assessment to your stakeholders, it helps sellers translate the contents into a compelling story in order to fully illustrate the value of your product or service. Adding in the capabilities of Presentify, your reports can then become an engaging and interactive journey that can be tailored based on the audience's specific needs.
These documents are meant to be a comprehensive guide so Admins can build and manage reports for their teams. This will include the various components of output reports, how tags work, and how to manage reports in the admin panel.
How do reports work?
Report templates are built using Report Tags that are tied to fields and calculations in the Analysis. Each tag is custom built to pull that piece of data into the report, whether it be a table, a chart, or text.
The report tag library can be found here.
Another component of reporting worth mentioning is Mnemonics. Mnemonics are pieces of text (usually structured in a way that makes sense for the action or item it's associated with) added into a special field in the tool. You should include mnemonics for all items created, including Benefits, Challenges, Pages, Page Sections, and Investments. This way, you have them in case you need them.
For example, you might add a mnemonic to a page section that calls out its name, such as secSalesChallenges. Best practices call for consistency across item types ("gv_" for all globals, or "chal_" for all challenges), and no spaces or dashes.
Reports are highly configurable and can be generated in multiple formats, including WORD, PPT, and PDF. Additionally, alternative variations can be created based on your audience, including detailed versions, executive reviews, or one-pagers.
Branding (PPT ONLY)
While there are some limitations to what you can change in the reports, there are still many ways to control elements of Powerpoint report templates, include fonts, styling, colors, and formatting. All of these capabilities are found at the top tool bar in the Slide Master option on the View tab.
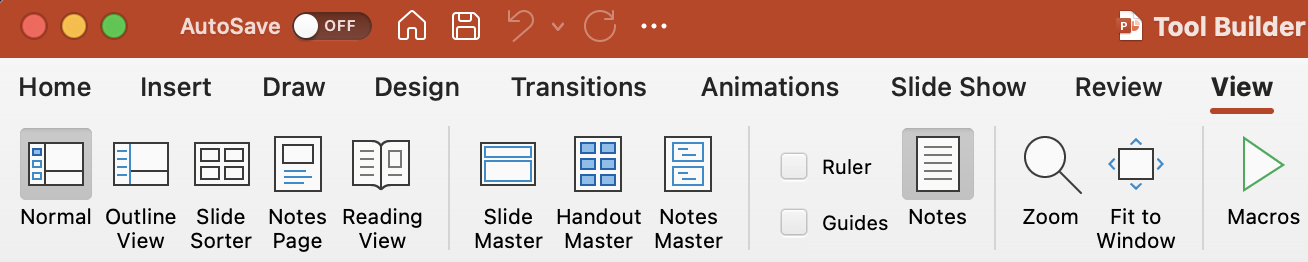
Note: You can edit any page of the template individually, but using Slide Master allows you to bulk change elements throughout the report, making it quicker and less error prone.
Here is what the Slide Master tool bar looks like:
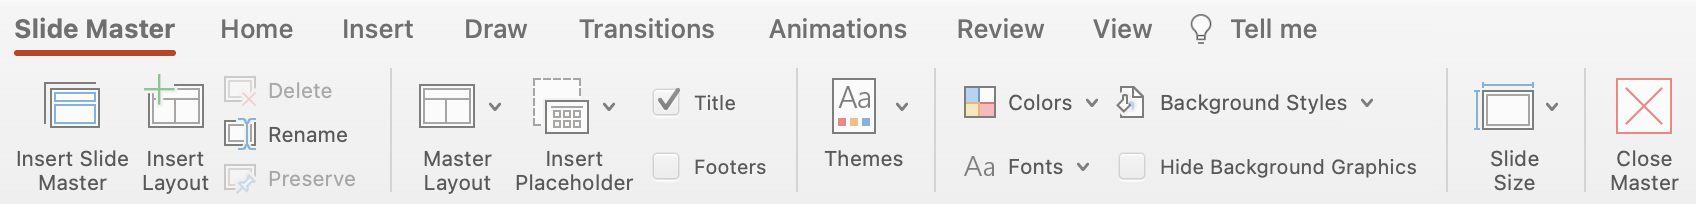
There are many options in Slide Master, but we will focus on those elements most often edited for customers.
Color
From the Color option (shown below) you have a couple options.
- Choose from a list of color schemes
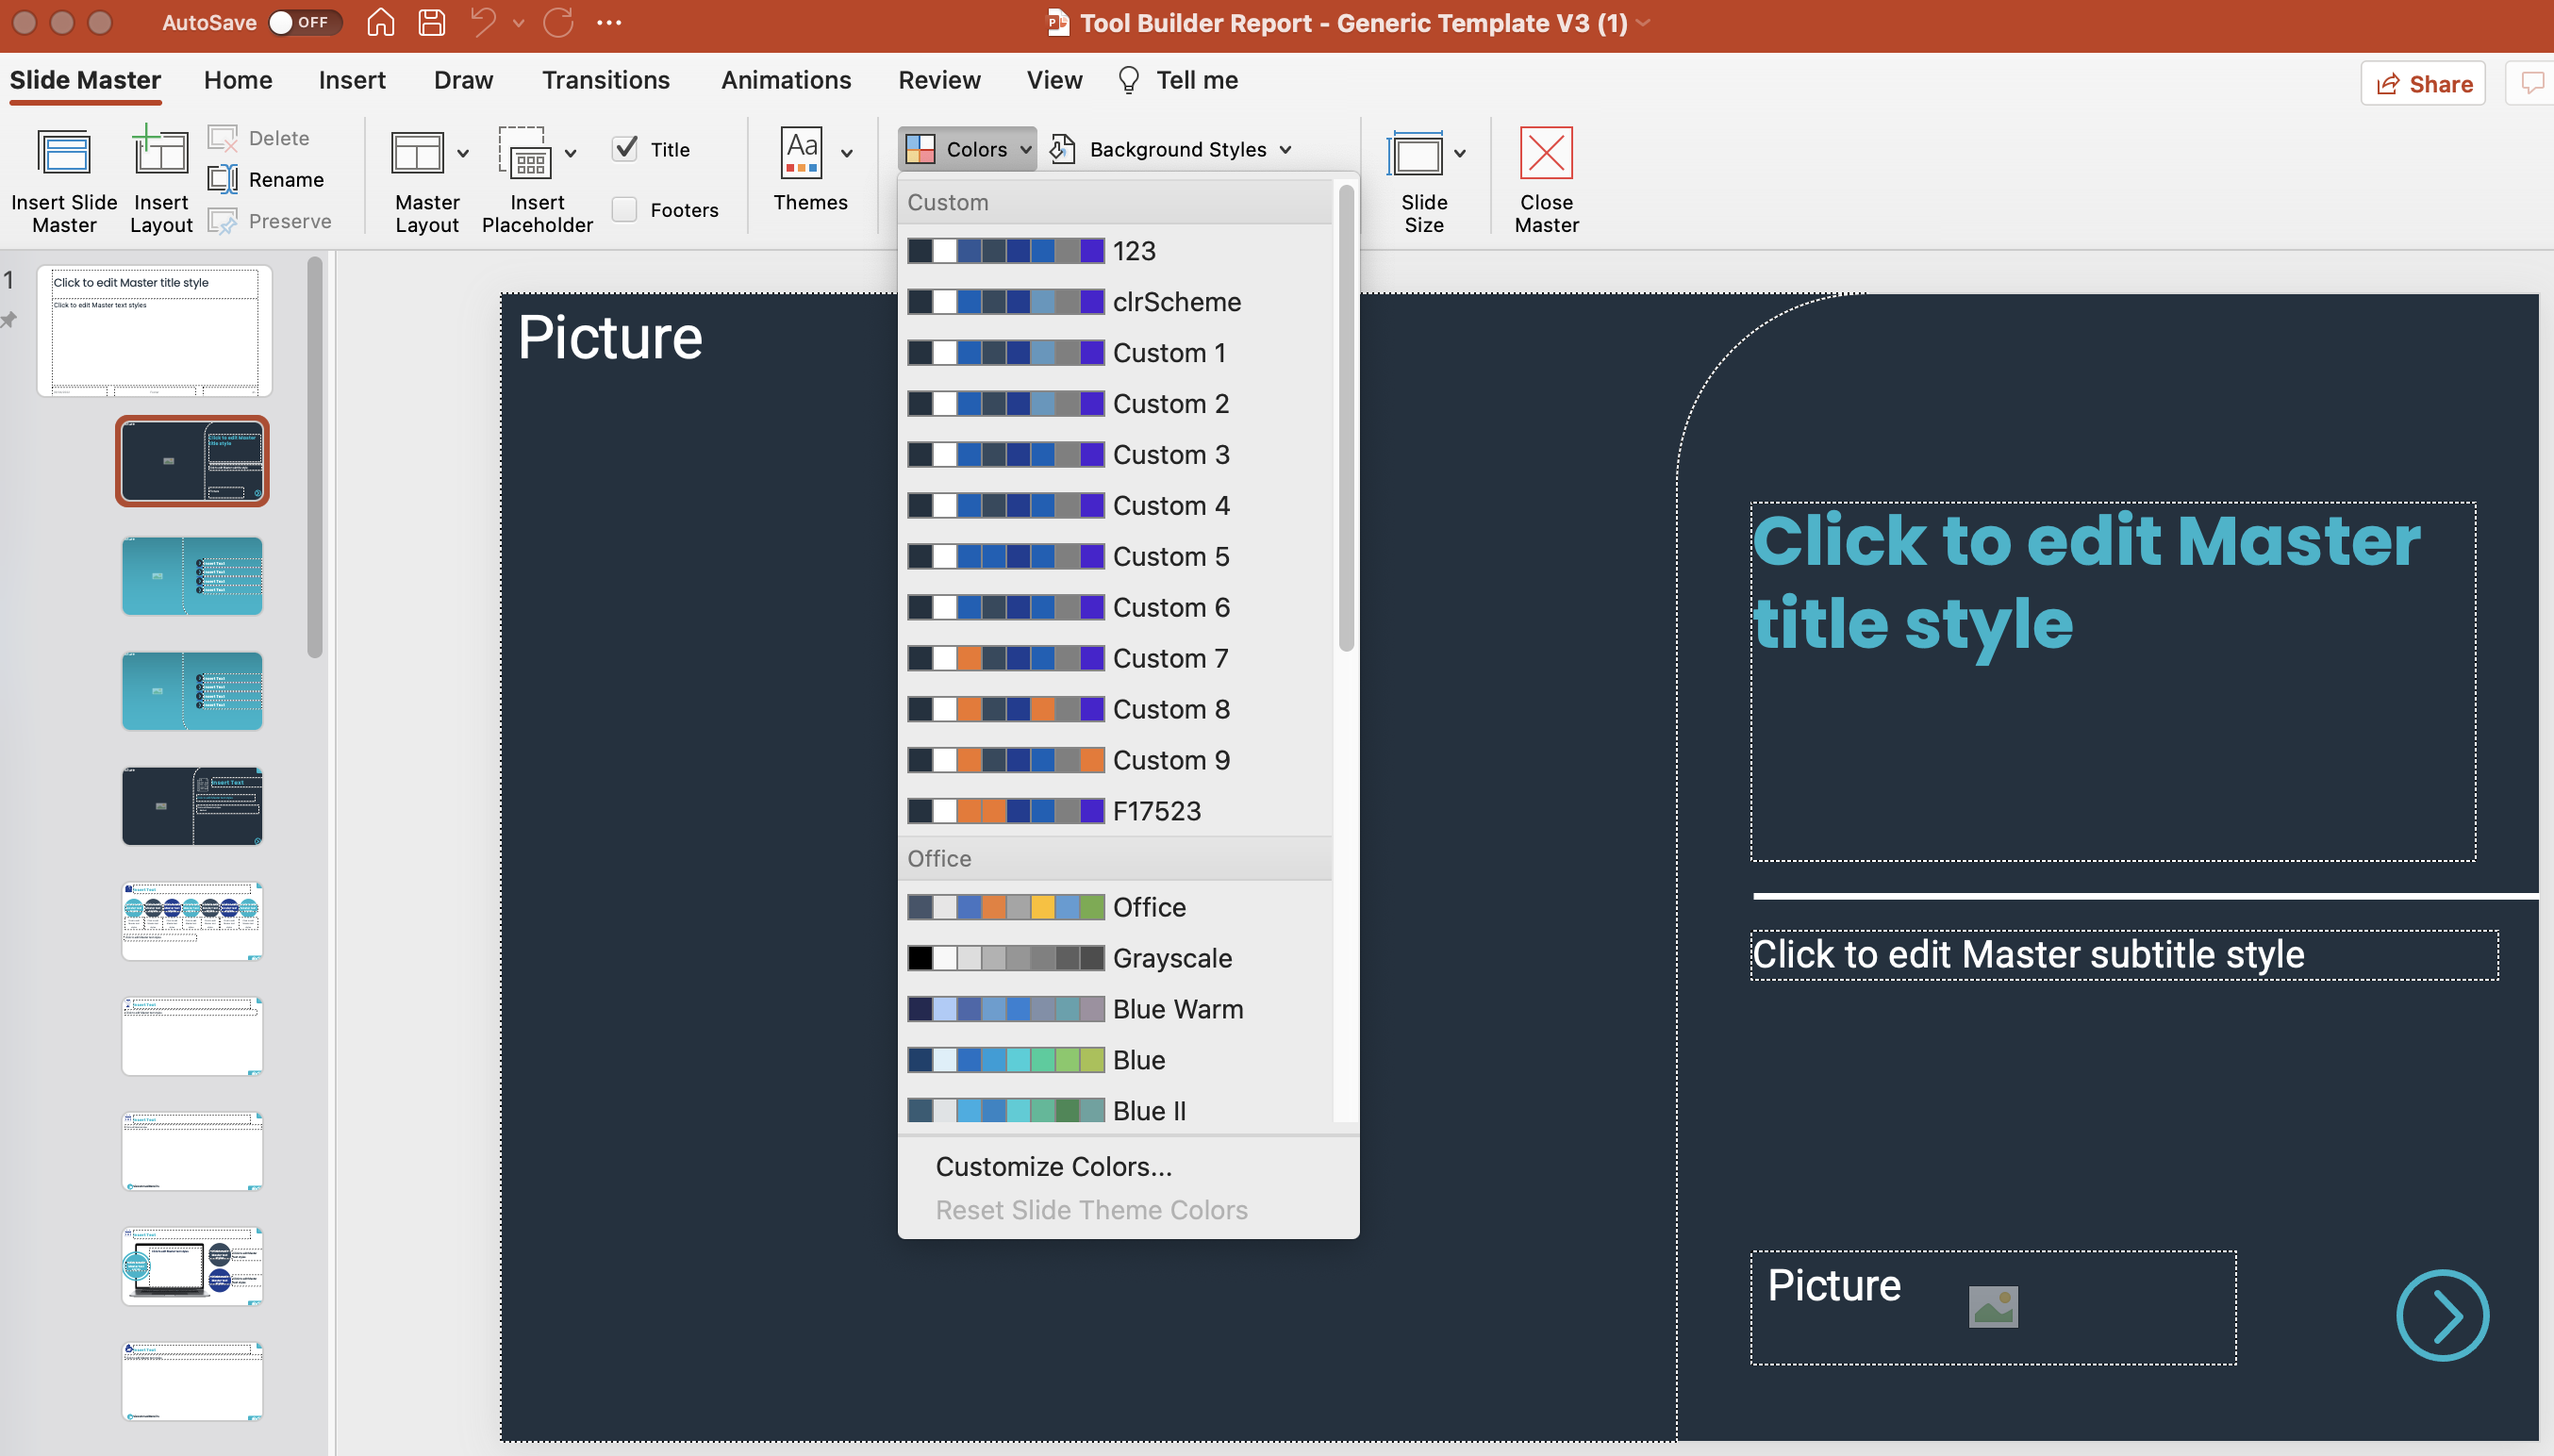
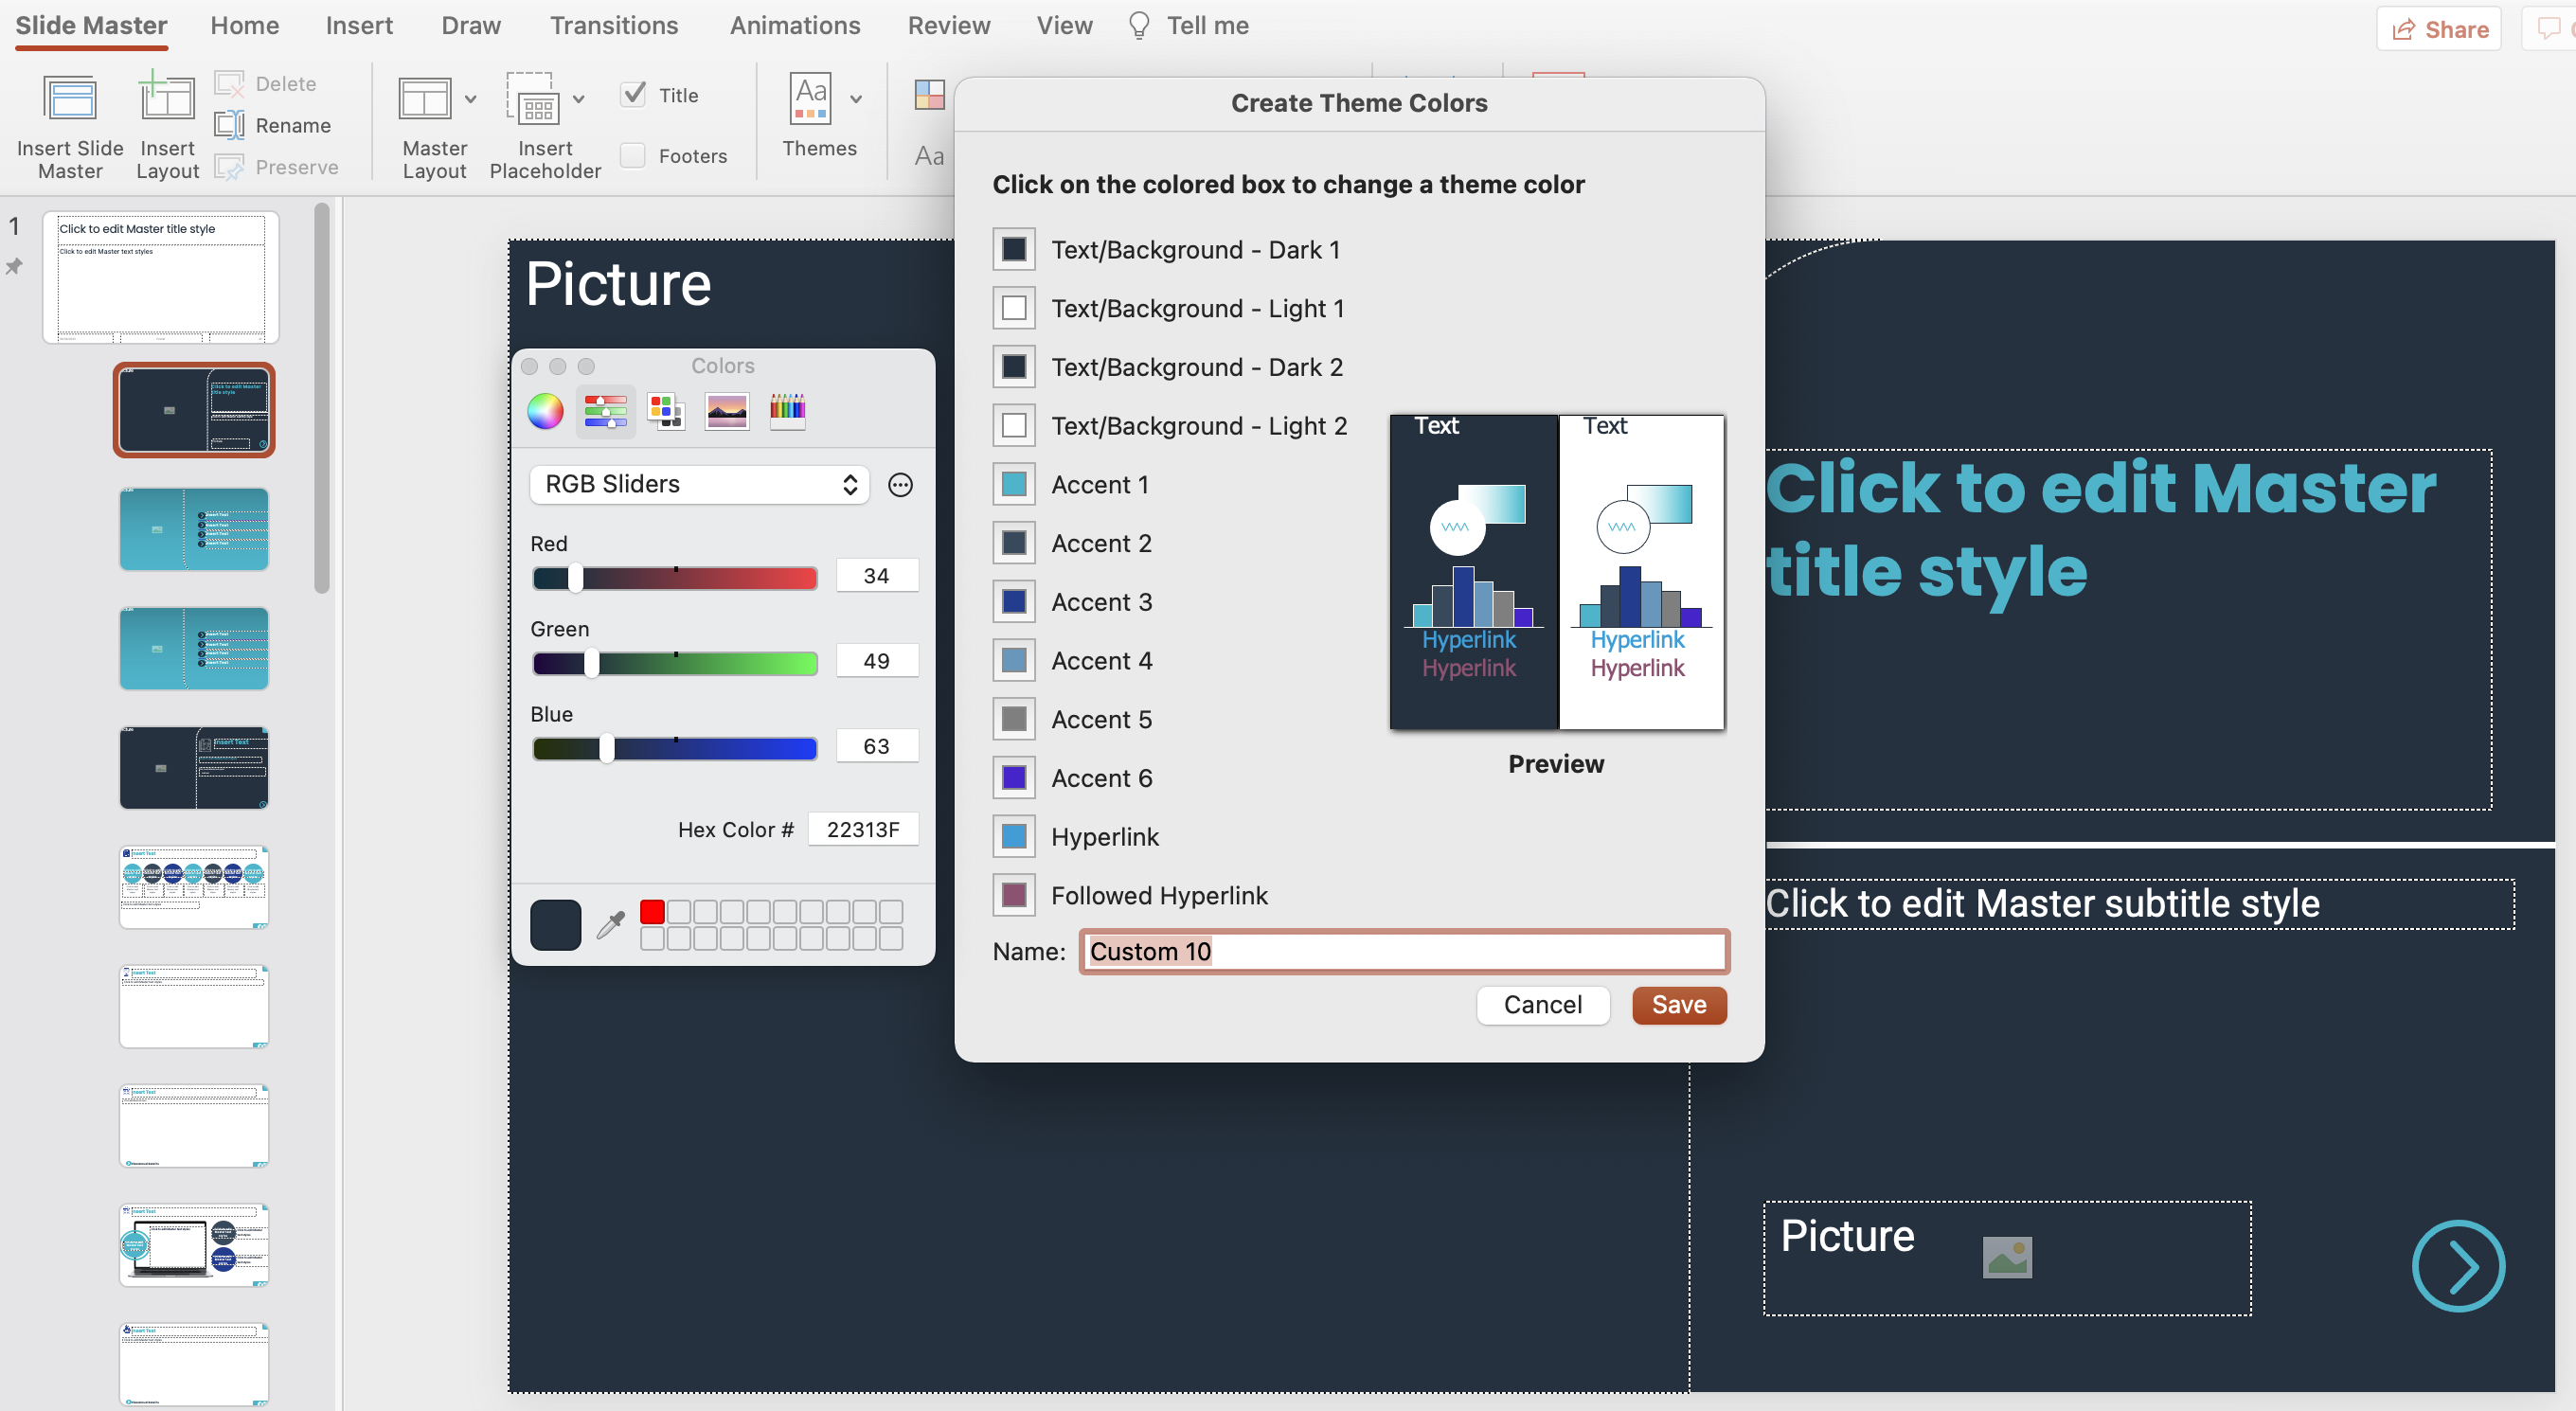
- Create your own color scheme
To make the process easier, color schemes that are saved from a clients template can also be accessed in another report template to mimic the correct branding.
Fonts
You can also change fonts to match your clients requirements. This is accessible from the tool bar under the Color option. Similar to color schemes, these choices can be applied to all pages throughout the tool.
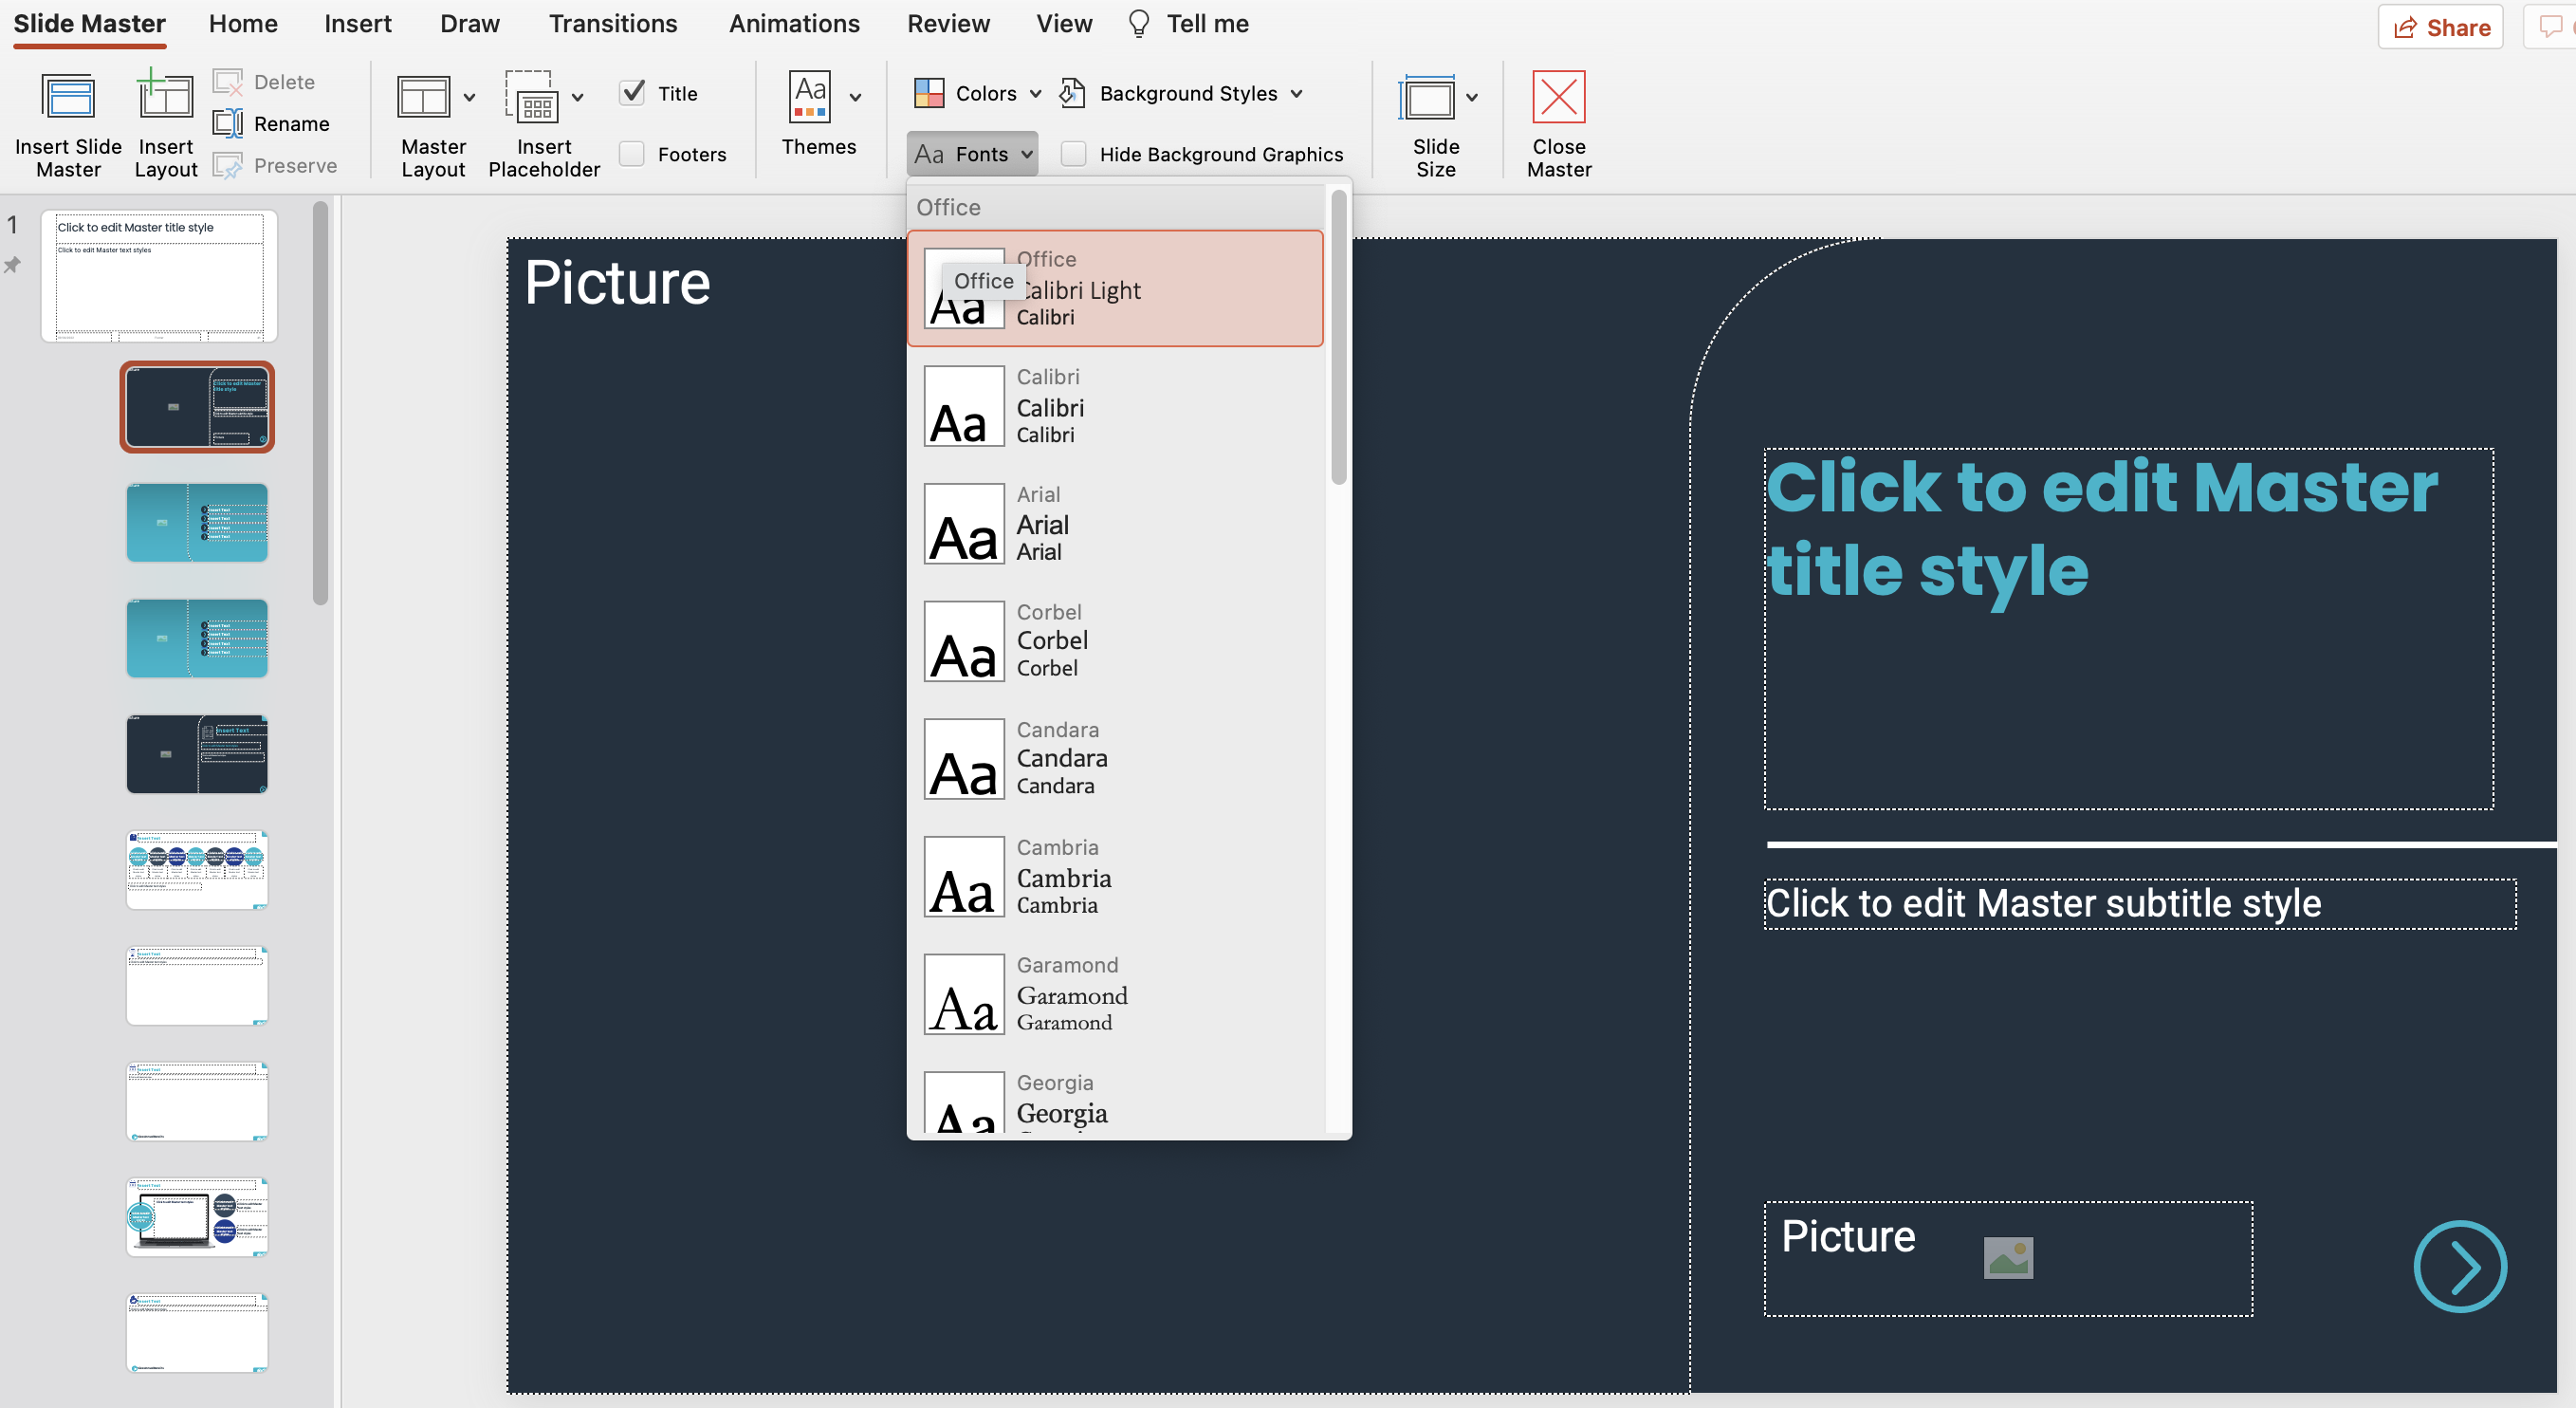
Note: some elements are not always affected by this selection due to the way they were added, so make sure to review the report to make any changes, if necessary.
Report Tags
After being built, each report tag is added to a library that is maintained by the Mediafly development team. The library can be found here, and some examples of tags and their uses can be found here.
Replies have been locked on this page!